

Retire at 55, 60, 65, or 70? Here's EXACTLY How Much You Need

My buddy Carlos told me something last year that stuck with me. He'd just turned 55, walked into his financial advisor's office with his wife Maria, and asked the big question: "Do we have enough?"
Most retirement calculators use flawed flat-spending assumptions. Real retirees spend less as they age, dramatically changing the math:
- Retire at 70: $550K - $750K (Social Security does heavy lifting)
- Retire at 65: $900K - $1.2M (2-year bridge to full benefits)
- Retire at 60: $1.3M - $1.7M (healthcare bridge critical)
- Retire at 55: $1.8M - $2.3M (longest bridge, most planning)
Key insight: The $2.8M "requirement" most calculators spit out ignores how spending actually works in retirement.
The advisor ran the numbers. Assumed they'd spend $80,000 a year (adjusted for inflation) for the next 35 years. Came back with a number: $2.8 million.
Carlos nearly fell out of his chair.
Here's the thing, though. That number was wrong. Not because the math was bad, but because the assumption underneath it was.
Real-world spending data tells a completely different story. Retirees don't spend the same amount every year for three decades. They spend a lot in their 60s, significantly less in their 70s, and even less in their 80s (until late-life healthcare costs create a bump). The Employee Benefit Research Institute found that inflation-adjusted spending drops 19% by age 75 and 34% by age 85. That's not a rounding error. That's hundreds of thousands of dollars most people are told they need but never actually spend.
So let's build your retirement number from the ground up. We're using actual spending data, phase-appropriate investment returns, a bridge strategy to Social Security, and a 15% buffer for the curveballs life throws at you. We'll calculate what a two-person household actually needs to retire at 55, 60, 65, and 70.
Ready? Let's go.
Your Spending Won't Stay Flat (and That Changes Everything)
Financial planners have a shorthand for retirement spending phases, and I love the names: go-go, slow-go, and no-go years.
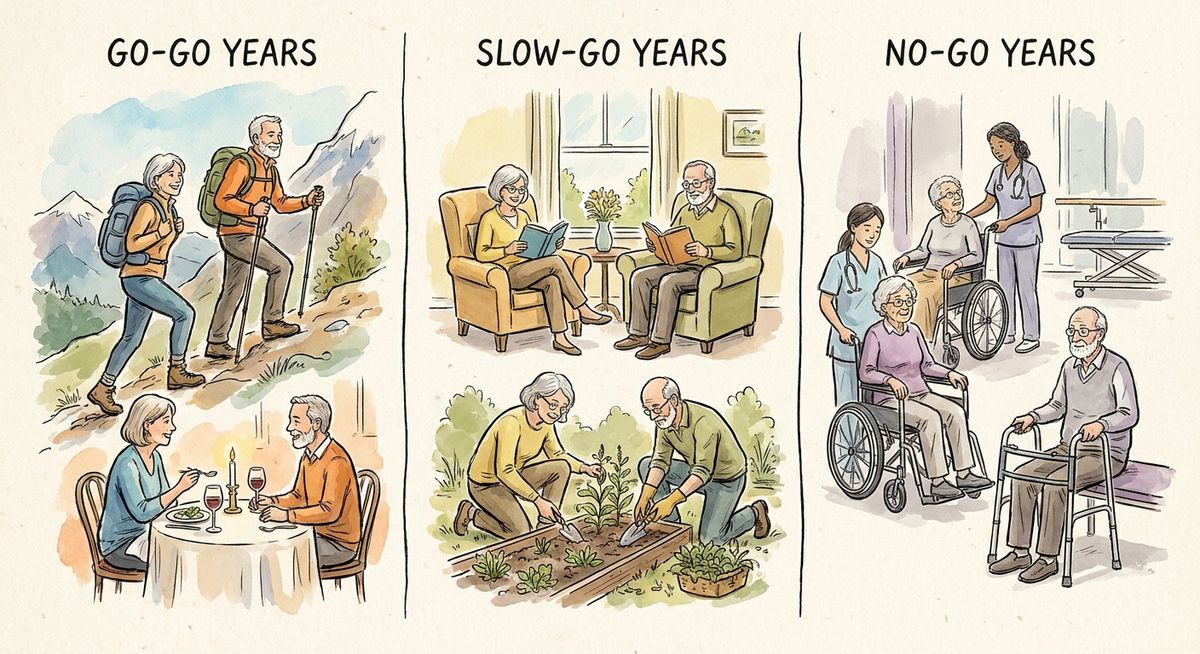
The Three Spending Phases
Go-go years (60s-early 70s): Peak spending on travel, dining, hobbies. Average household spending: $65,000/year.
Slow-go years (mid-70s-early 80s): Reduced activity and discretionary spending. Lowest spending period.
No-go years (mid-80s+): Healthcare costs push spending back up, creating the "retirement spending smile."
Go-go years (typically your 60s into early 70s). This is peak spending. You're traveling, dining out, tackling home projects, picking up new hobbies. Discretionary spending is at its highest. BLS data puts average annual spending for households aged 65 to 74 at roughly $65,000.
I see this all the time with friends who've recently retired. My friend Janet and her husband spent their first year bouncing between Portugal, Japan, and Costa Rica. They had the time of their lives. They also blew through more cash than they expected.
Slow-go years (mid-70s through early 80s). Activity slows down. You're eating out less, traveling less, driving less. Core costs like housing and food hold relatively steady, but discretionary spending drops sharply. Total spending hits its lowest point during this phase.
No-go years (mid-80s and beyond). Overall spending has declined significantly from your go-go years, but healthcare and potential long-term care costs push the number back up. This creates what researcher David Blanchett calls the "retirement spending smile." It's a U-shaped curve where costs dip in the middle and rise at the end.
Here's what this looks like for a hypothetical couple:
| Age | Annual Spending | Key Drivers |
|---|---|---|
| 65 | $85,000 | Peak travel, dining, activities |
| 70 | $80,000 | Continued high discretionary spending |
| 75 | $72,000 | Reduced activity and travel |
| 80 | $75,000 | Healthcare costs begin to rise |
| 85 | $95,000 | Significant healthcare and care costs |
That late-life spike is real, and it's driven largely by healthcare. Fidelity estimates a 65-year-old couple will spend $345,000 on healthcare throughout retirement (and that excludes long-term care). Nursing home costs run over $9,000 per month for a semi-private room nationally. Those numbers deserve serious attention.
But here's the critical insight most calculators miss. Even with that late-life healthcare spike, total lifetime spending is still far lower than what a flat-spending model predicts. RAND researchers confirmed this holds true "not just among those with low wealth but even among households in the upper fourth of the wealth distribution." Whether you're frugal or affluent, you spend less as you age.
Think about your own parents or grandparents. Are they spending more now than they were at 65? Probably not. That's the pattern. And it changes the math dramatically.
The Numbers: What You Actually Need by Retirement Age
Alright, let's get into the good stuff. For each scenario below, we're using a two-person household with these assumptions:
- Starting spending: $80,000/year (close to the BLS average for all consumer units, adjusted slightly down for a retirement budget)
- Spending decline: 1% real decline per year in the first decade, 2% in the second, 1% in the third (per the Kitces/Basu framework)
- Investment returns: 5% in the first decade (conservative, to protect against sequence risk), 6% in the second, 6.5% in the third
- Social Security: $38,496/year combined (the average retired couple's benefit in 2026), claimed at age 67
- 15% buffer added to total portfolio need
- Healthcare before 65: $20,000 to $24,000/year for the couple (ACA marketplace, unsubsidized; less if you qualify for subsidies through income management)
If you spend more or less than $80,000, adjust these numbers proportionally. Someone spending $60,000 a year needs roughly 25% less. Someone spending $100,000 needs about 25% more.
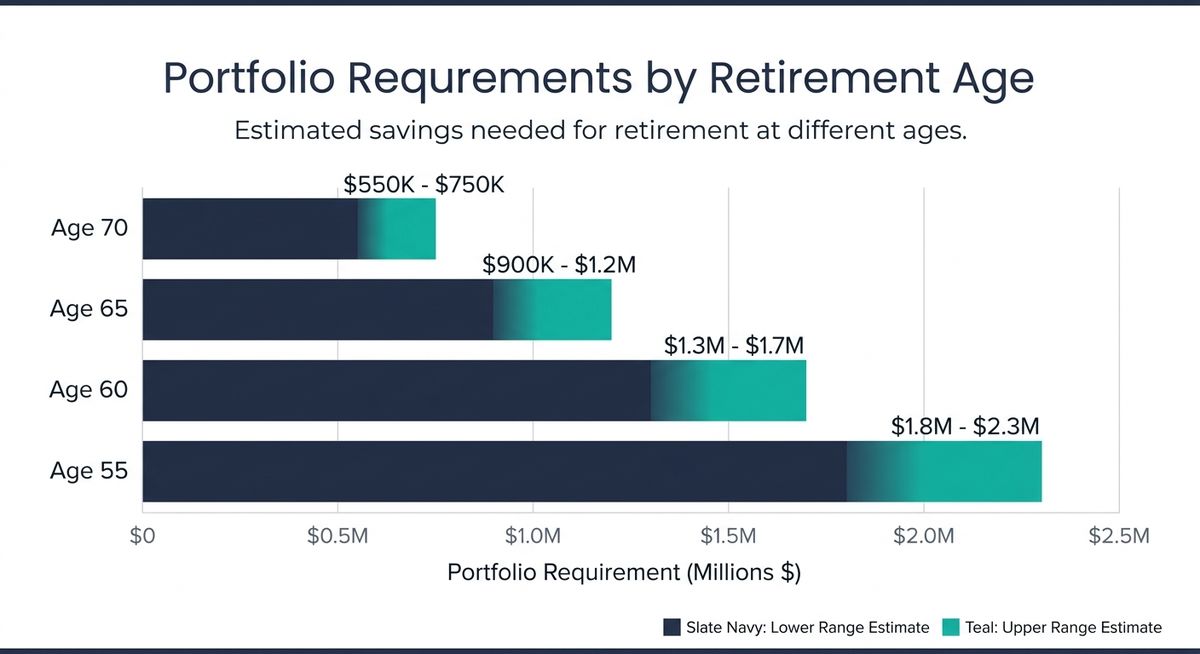
Retire at 70
- Portfolio Need $550K - $750K
- Social Security Coverage 50%+ of expenses
- Bridge Period Zero
- Healthcare Medicare eligible
- Risk Level Lowest
Retire at 65
- Portfolio Need $900K - $1.2M
- Social Security Bridge 2-7 years
- Healthcare Medicare eligible
- Peak Spending Years Covered
- Risk Level Moderate
Retire at 60
- Portfolio Need $1.3M - $1.7M
- Social Security Bridge 7 years
- Medicare Bridge 5 years
- Healthcare Costs $100K - $120K
- Risk Level Higher
Retire at 55
- Portfolio Need $1.8M - $2.3M
- Social Security Bridge 12 years
- Medicare Bridge 10 years
- Healthcare Costs $200K+
- Risk Level Highest
Retire at 70
This is the most forgiving scenario. Social Security is already flowing (and if you delayed to 70, your combined benefit could be substantially higher than average). Your bridge period is zero. Your retirement horizon is roughly 20 to 25 years.
Portfolio need: approximately $550,000 to $750,000 (with Social Security covering 50% or more of expenses)
At 70, Social Security does the heavy lifting. If both spouses delayed benefits to 70, a higher-earning couple could receive $10,362 per month combined ($124,344 per year, the 2026 maximum). Even at average benefits, Social Security covers nearly half of an $80,000 budget. Your portfolio fills the gap and funds the healthcare spike in your 80s.
I know a lot of people look at $550,000 and think, "Wait, that's it?" Yep. When Social Security carries half the load and you've only got 20 to 25 years to fund, the number is a lot more approachable than you'd think.
Retire at 65
You need to bridge two years to full Social Security at 67 (or five to eight years if you're delaying benefits for a larger check). Your spending is at its peak, and Medicare kicks in immediately, eliminating the private insurance cost.
Portfolio need: approximately $900,000 to $1.2 million
The big variable here is whether you claim Social Security at 65 (with a 13.3% reduction from your full benefit) or wait. Every year you delay past 67 adds 8% to your benefit permanently. That's a decision worth sitting with for a while.
Retire at 60
Now we're getting into trickier territory. You're bridging five years to Medicare and seven years to full Social Security. Those five years of private healthcare coverage could cost $100,000 to $120,000 for a couple, and that's before any significant medical events. Your portfolio needs to carry the full weight of spending for at least seven years.
Portfolio need: approximately $1.3 million to $1.7 million
This is where the bridge strategy becomes essential (more on that below). You need a plan for accessing funds before age 59½ without penalties, and you need a clear healthcare funding strategy. It's totally doable. It just takes more planning.
Retire at 55
The most ambitious scenario. You're facing 10 years without Medicare, 12 years without full Social Security, and potentially 35 or more years of retirement. Healthcare alone could cost $200,000 or more before you hit 65.
Portfolio need: approximately $1.8 million to $2.3 million
The Real Surprise: It's Still Less Than Expected
That $1.8-2.3 million range is significantly less than the $2.8 million a flat-spending calculator would spit out. The difference comes entirely from modeling realistic spending decline rather than assuming you'll spend $80,000 every year until you're 90.
Notice something? That's significantly less than the $2.8 million a flat-spending calculator would spit out. The difference comes entirely from modeling realistic spending decline rather than assuming you'll spend $80,000 (inflation-adjusted) every year until you're 90.
But here's the catch. Retiring at 55 demands the most planning precision. The margin for error is thinnest, the bridge is longest, and sequence of returns risk is highest. Can you do it? Absolutely. Should you wing it? Absolutely not.
The Bridge: Covering the Gap Before Social Security
If you retire before 67, you need a bridge. That's a plan to fund your life before Social Security replaces a chunk of your spending. The bridge isn't a single account. It's a coordinated strategy across multiple sources.
I think of it like planning a road trip across the country. You're not going to make it on one tank of gas. You need to know where every fuel stop is before you leave.
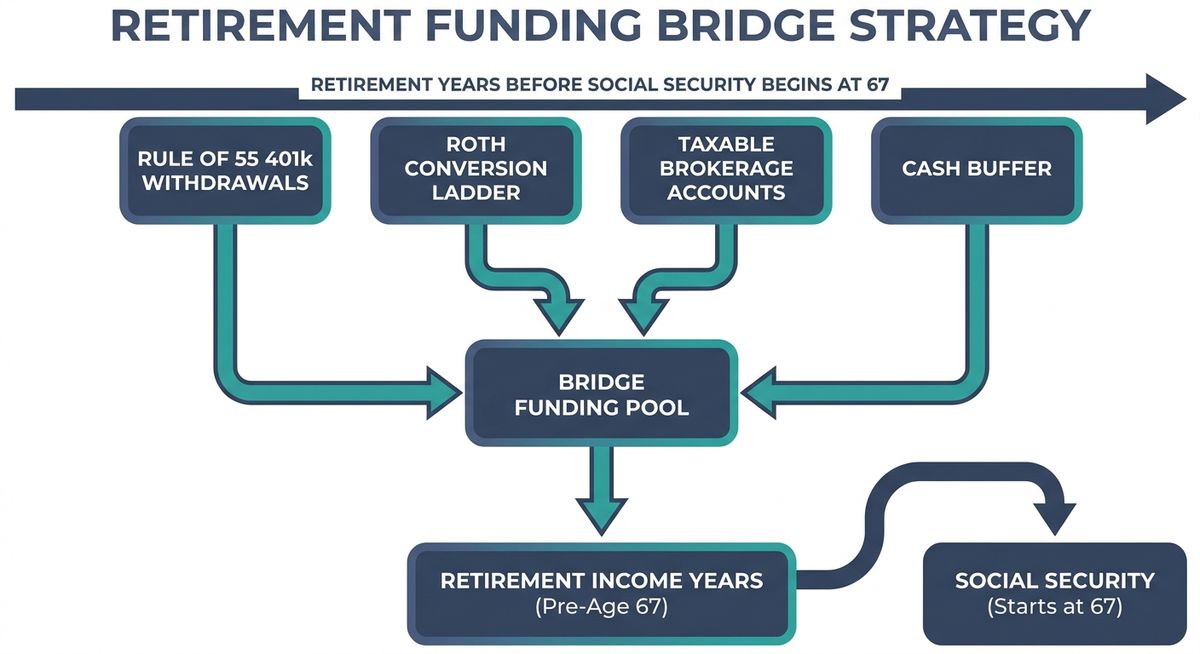
Your bridge toolkit:
- Rule of 55 withdrawals. If you leave your employer at 55 or later, you can pull from that employer's 401(k) penalty-free. Important detail here: this only applies to the plan of the employer you separated from, not old 401(k)s or IRAs. And if you roll those funds to an IRA, you lose this option. So think twice before rolling over if you're retiring at 55.
- Roth conversion ladder. Convert traditional IRA funds to Roth over several years. After a five-year seasoning period, you can withdraw the converted amounts tax- and penalty-free. This requires planning that starts years before retirement. If you're 50 and thinking about retiring at 55, now is the time to start these conversions.
- Taxable brokerage accounts. No age restrictions, no penalties. You pay capital gains tax on profits, but the flexibility is unmatched. This is your most versatile tool.
- Cash buffer. Two to four years of expenses in high-yield savings accounts and short-term CDs. At current rates (4% to 5% APY), this money works for you while staying completely liquid.
The cash buffer deserves special attention. Here's why.
The 70% Rule: Why Cash Buffers Matter
Morningstar research found that portfolios suffering losses in the first five years accounted for 70% of retirement plan failures. Two identical portfolios can end up hundreds of thousands apart based solely on early market timing.
Morningstar research found that portfolios suffering losses in the first five years accounted for 70% of retirement plan failures. Let that sink in. Two retirees with identical portfolios can end up hundreds of thousands of dollars apart based solely on whether markets dropped early or late in their retirement. It's wild. And it's why keeping two to four years of expenses in cash means you never have to sell investments during a downturn.
Here's my favorite part of the strategy: replenish the buffer during good years. When the market is up, skim gains to refill your cash reserves. When the market is down, spend from the buffer and leave your investments alone. It's simple, it's boring, and it works.
Social Security: The Biggest Lever in Your Plan
I talk about Social Security a lot because the timing of your claim is worth more than almost any other retirement decision you'll make. And most people don't give it the attention it deserves.
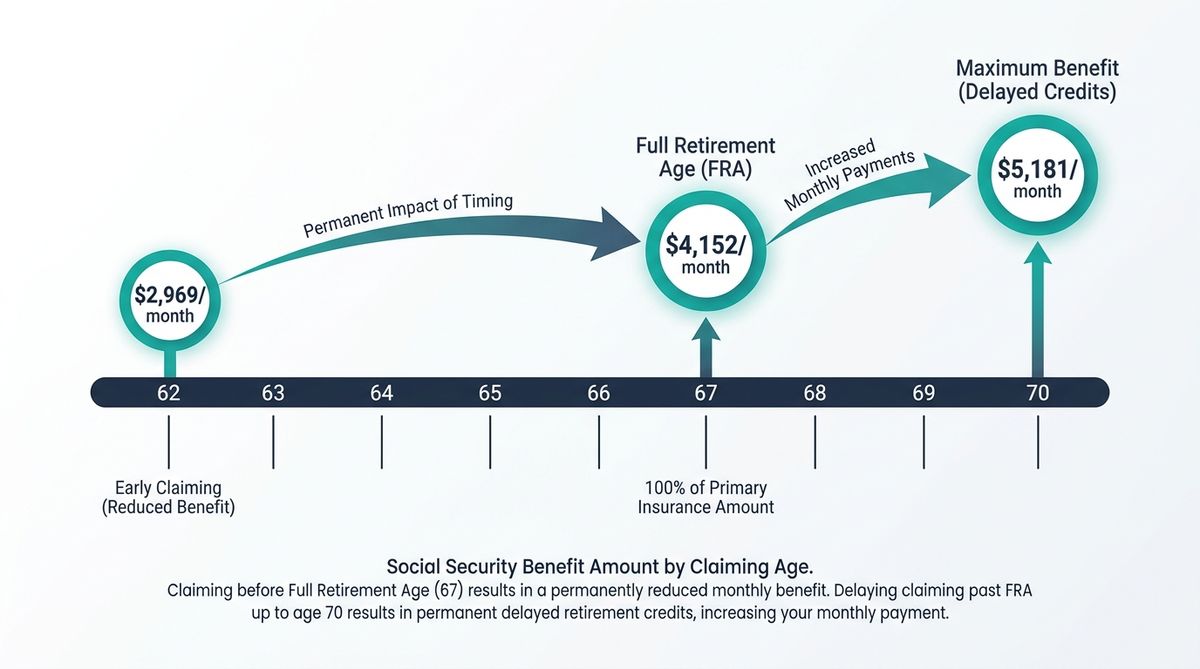
The numbers tell the story. In 2026, the maximum benefit at age 62 is $2,969 per month. At full retirement age (67), it's $4,152. At 70, it's $5,181. That's more than a 75% increase from 62 to 70. And it's permanent. Every monthly check for the rest of your life (and potentially your surviving spouse's life) is either boosted or reduced by this single decision.
Delayed retirement credits add 8% per year from 67 to 70. That's a guaranteed return you won't find in any investment. Seriously, show me a bond or a dividend stock that guarantees 8% a year. I'll wait.
Show me a bond or a dividend stock that guarantees 8% a year. I'll wait.
For a couple, coordinating claims can be really smart. One spouse claims early for cash flow while the other delays for the maximum benefit. That kind of coordination can optimize lifetime income significantly.
The biggest mistake I see? People promising themselves they'll delay, then panicking during a market downturn and claiming early to stop portfolio withdrawals. As AARP puts it: "That choice permanently trims your benefit by up to 30%." The bridge strategy above exists precisely to prevent this. Build the bridge so you never feel pressured to claim early out of fear.
ACA Subsidy Planning
If you retire early and keep income low, you may qualify for ACA subsidies by managing your Modified Adjusted Gross Income below 400% of the Federal Poverty Level (roughly $62,600 for a single filer in 2026). The difference between qualifying and paying full price can be $18,000+ per year for a couple.
One planning lever many people overlook. If you retire early and keep income low, you may qualify for ACA subsidies by managing your Modified Adjusted Gross Income below 400% of the Federal Poverty Level (roughly $62,600 for a single filer in 2026). Roth conversions, capital gains harvesting, and withdrawal sequencing all play a role here.
This matters more now than ever. Enhanced ACA subsidies expired at the end of 2025, and unsubsidized benchmark premiums jumped 20% or more for 2026. The difference between qualifying for subsidies and paying full price is worth thousands of dollars a year. For some couples, it can mean the difference between a $6,000 annual premium and a $24,000 one. That's worth some careful income management.
Three Threats That Can Derail Your Plan
Even with realistic spending projections and a solid bridge, three risks deserve your attention. I'm not trying to scare you here. I just want you to go in with your eyes open.
1. Sequence of Returns Risk
As Michael Kitces warns: "The real problem is not a bad year or two but a bad decade to start off retirement." This is why we used conservative 5% returns for the first decade in our calculations, and why the cash buffer is non-negotiable. If markets crater in your first five years, your portfolio may never recover without spending adjustments.
I've seen this play out with people I know. My friend Greg retired in early 2008. You can imagine how that went. He made it through because he had cash set aside. His neighbor, who retired the same year without a buffer, went back to work within 18 months. Same savings. Different strategy. Completely different outcome.
2. Healthcare Cost Inflation
Healthcare costs have consistently outpaced general inflation, and the gap compounds over a 30-year retirement. For early retirees, the 2026 ACA landscape is particularly challenging. A 55-year-old couple buying unsubsidized Silver plans in 2026 could pay $24,000 to $30,000 a year just for premiums, depending on location. That's a real number that needs to be in your plan.
3. Lifestyle Inflation in Early Retirement
The go-go years are exciting. You finally have time for that extended European trip, the kitchen renovation, the golf membership. Many new retirees spend more in their first two years than they planned, burning through their buffer before the spending decline even begins.
I get it. You've waited decades for this freedom. But here's what I'd suggest: set your first-year budget before you retire and track it monthly. Give yourself permission to enjoy retirement, but know your numbers. The people who do this well are the ones who can keep enjoying it for 30 more years.
🎯 What to Do Next
- Calculate your spending baseline: Pull up your most recent spending and sort it into fixed (housing, insurance, food), discretionary (travel, dining, hobbies), and healthcare categories.
- Run your Social Security scenarios: Use SSA.gov's calculator to see benefits at 62, 67, and 70. The lifetime income difference is likely six figures.
- Map your bridge strategy: Know exactly which account each withdrawal comes from and what the tax impact will be from retirement to Social Security.
- Size your cash buffer: Multiply your annual spending by 2-4 years. Get this money into high-yield savings and short-term CDs before you retire.
Pull up your most recent spending and sort it into three categories: fixed (housing, insurance, food), discretionary (travel, dining, hobbies), and healthcare. That's your starting number.
Then answer three questions:
- When will you claim Social Security? Run your numbers at 62, 67, and 70 using SSA.gov's calculator. The difference in lifetime income is likely six figures. This is probably the single most valuable hour you'll spend on retirement planning.
- What's your bridge plan? Map every dollar of spending from retirement to Social Security. Know exactly which account each withdrawal comes from and what the tax impact will be.
- How big is your cash buffer? Multiply your annual spending by two (minimum) to four (ideal). That money goes into high-yield savings and short-term CDs before you retire, not after.
The retirement number you actually need is almost certainly different from what a simple calculator tells you. It might be lower (because spending declines are real and significant). It might be higher (because healthcare before 65 is expensive and getting more so). But it won't be a mystery.
Run the math with realistic assumptions. Build your bridge. Size your buffer. Time your Social Security claim deliberately.
You don't need a perfect plan. You need an honest one.
And if you've made it this far, you're already way ahead of most people. The fact that you're thinking about this stuff, running numbers, asking the right questions? That puts you in a great position.
Thanks for reading. Now go run those numbers.