

Why Most Retirement Calculators Are Wrong (And Could Cost You Your Retirement)

So here's something that should bother you. You sit down, plug your age, savings, and income into a retirement planning calculator. It thinks for a second and spits out a number. You're either "on track" or you're not. Easy, right?
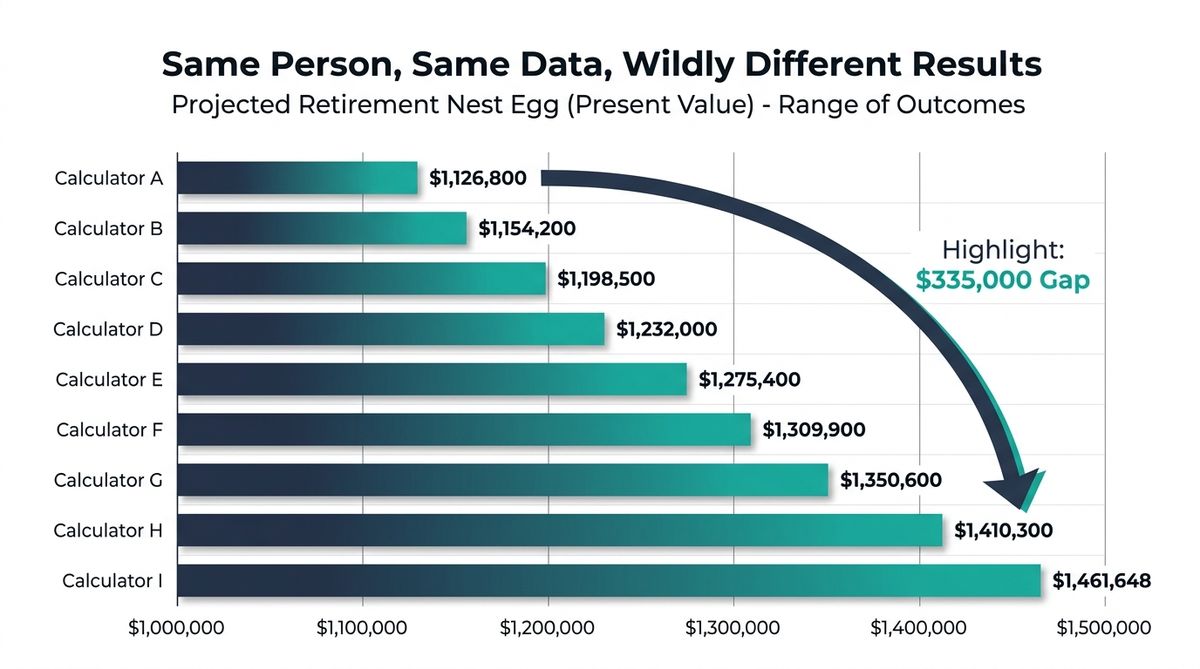
Retirement calculators can give wildly different results for the same person, with projections varying by $335,000 or more. The biggest flaws:
- They use misleading "average" returns that ignore volatility
- They miss sequence of returns risk — when bad years happen matters
- Healthcare inflation is double general inflation rates
- They ignore the "retirement spending smile" and tax complexities
Solution: Use Chance of Success simulations and stress-testing instead of single-number projections.
Not so fast.
Run that same information through nine different retirement calculators and you'll get savings estimates ranging from $1,126,800 to $1,461,648. That's a $335,000 gap. Monthly income projections? Just as messy. One study found ranges of $3,772 to $6,013 per month. A separate study, using a different profile, found $6,242 to $9,703. Same person. Same numbers. Answers that differ by thousands of dollars per month.
Researchers at Texas Tech and Utah Valley University tested 36 popular retirement calculators using a hypothetical couple's finances. Twenty-five of those calculators, nearly 70%, incorrectly told the couple they were good to go. They were not good to go.
The False Confidence Crisis
70% of popular retirement calculators gave false "on track" readings to couples who would actually run out of money. The tools we trust most may be the ones misleading us most.
Think about that for a second. If the tools we're trusting to plan the most important financial transition of our lives can't even agree with each other, something is seriously off. And the consequences aren't just theoretical. Roughly 45% of Americans may run out of money in retirement despite having a financial plan. Sixty-four percent fear going broke more than they fear dying.
The calculator isn't trying to mislead you. But it is misleading you. Here are the five biggest reasons why, and what you can actually do about it.
1. "Average Returns" Are a Dangerous Illusion
Every retirement calculator needs to assume some rate of return on your investments. Most use a single flat number, typically 7% to 10%, applied evenly across every year of your retirement. Three of the calculators in that Texas Tech study had preset rates that users couldn't even change. Just locked in somewhere between 5% and 10%.
Seems reasonable enough. Until you think about what "average" actually means in the stock market.
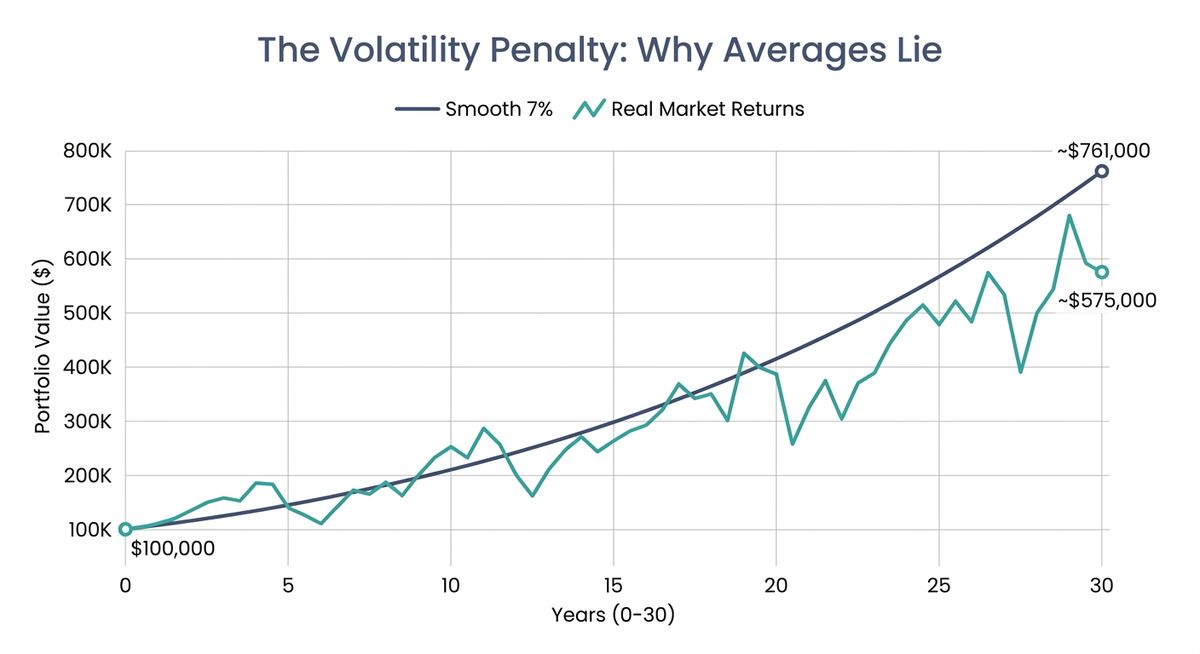
The Volatility Trap
You invest $100,000. Year one, the market drops 50%. Year two, it gains 50%. Your "average return" over those two years is 0%. But your portfolio? It's sitting at $75,000. You lost a quarter of your money on a "zero percent average."
This is the difference between arithmetic returns (the simple average) and geometric returns (what you actually earn). Volatility eats away at wealth in a way that flat projections simply can't capture. Studies show that fixed-rate calculators overestimate ending balances by 30% to 50% compared to models that account for real market behavior.
So that green "on track" indicator on your retirement calculator? It might be built on a number that has never existed in any actual market environment.
2. Sequence of Returns Risk: The Retirement Killer Nobody Warns You About
This one keeps me up at night, honestly. It's the single most dangerous blind spot in retirement planning, and most calculators ignore it completely.
Sequence of returns risk is actually simple to explain, even though it's devastating in practice. When you experience good and bad market years matters just as much as the returns themselves. And it matters most during what financial planners call the "retirement red zone," the five years before and ten years after you stop working.
Retiree A: Good Early Years
- Starting Portfolio $1,000,000
- Annual Withdrawals $45,000
- Average Return 7% annually
- Money Lasts 40+ years
Retiree B: Bad Early Years
- Starting Portfolio $1,000,000
- Annual Withdrawals $45,000
- Average Return 7% annually
- Money Lasts 25 years
Same savings. Same spending. Same average performance. One retires comfortably. The other is broke at 85. That should terrify all of us.
Retirement researcher Wade Pfau found that roughly 77% of a portfolio's final outcome can be explained by the returns of just the first 10 years. A major downturn early in retirement, when you're withdrawing from a shrinking portfolio, creates a hole that even strong later returns can't fill. Someone who retired in January 2000 faced a completely different reality than someone who retired in January 2010, even if their 30-year average returns end up identical.
This is exactly why the first 5 years of retirement require smart budgeting strategies that most calculators completely ignore.
Your calculator shows one path. Reality offers thousands. And a whole lot of them lead somewhere very different from that single projected line on the screen.
3. Inflation Isn't One Number (And the Real One Is Worse Than You Think)
Most calculators assume inflation runs somewhere between 2.5% and 3% per year. For groceries and gasoline, that might be reasonable. For the expense that will likely consume the largest share of your retirement budget? It's dangerously wrong.
I'm talking about healthcare.
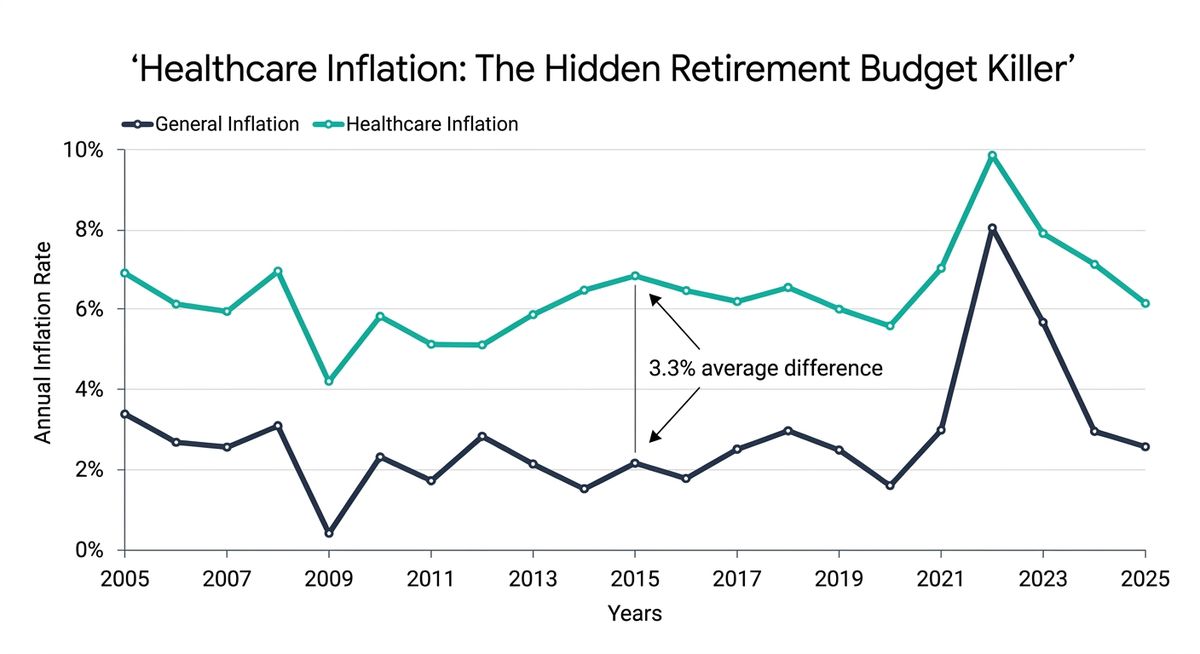
Healthcare inflation has been running at roughly 5.8% annually. Medicare Part B premiums jumped 9.7% in 2026 alone, going from $185 to $202.90 per month. Meanwhile, the Social Security cost-of-living adjustment was just 2.8%. That gap is getting wider, not narrower.
The Million-Dollar Healthcare Reality
HealthView Services projects that a 65-year-old couple will spend $661,812 in today's dollars on healthcare over their lifetime. Factor in inflation over time, and that climbs to $955,411 — nearly a million dollars for healthcare alone.
Now let me hit you with some numbers that honestly floored me when I first dug into them. Fidelity's 2025 estimate puts lifetime healthcare costs for a 65-year-old individual at $172,500. For a couple, roughly $315,000. But here's the thing. Those figures only cover Medicare premiums and cost-sharing. HealthView Services' 2026 analysis, which includes dental, vision, hearing, and out-of-pocket costs, puts a couple's projected lifetime healthcare spending at $661,812 in today's dollars. Factor in healthcare inflation over time, and the future-value number climbs to $955,411.
That's potentially close to a million dollars. For healthcare alone.
And it gets worse. Seventy percent of people who reach age 65 will need some form of long-term care, according to the U.S. Department of Health and Human Services. Nursing home costs now run $115,000 to $130,000 per year. Most retirement calculators don't model long-term care costs at all.
Here's the stat that really puts it in perspective. HealthView Services found that an average 65-year-old couple will need 84% of their Social Security benefits just to cover healthcare expenses. For a couple retiring at 55, that figure climbs to 104%. Let that sink in. Before you've paid for housing, food, travel, or anything else that makes retirement worth having, healthcare has already consumed your entire Social Security check. And then some.
Understanding how Medicare supplement insurance decisions impact your budget becomes critical when healthcare costs consume this much of your retirement income.
A 2% error in your inflation assumption doesn't sound like much. But compounded over 25 or 30 years, it can double your actual retirement needs compared to what the calculator projected.
4. Your Spending Won't Follow a Straight Line
Here's an assumption buried in almost every retirement planning calculator. You'll spend a fixed percentage of your pre-retirement income (usually 80% to 85%) every single year for the rest of your life.
Real retirees don't spend that way. Not even close.
Ask a retiree. They'll tell you when they first retired, they were traveling constantly, eating out three times a week, picking up new hobbies left and right. Five years later? They're perfectly happy reading in the backyard most afternoons.
David Blanchett at Morningstar actually studied this and found that inflation-adjusted spending declines roughly 1% per year throughout most of retirement. After two decades, real consumption drops significantly from where it started.
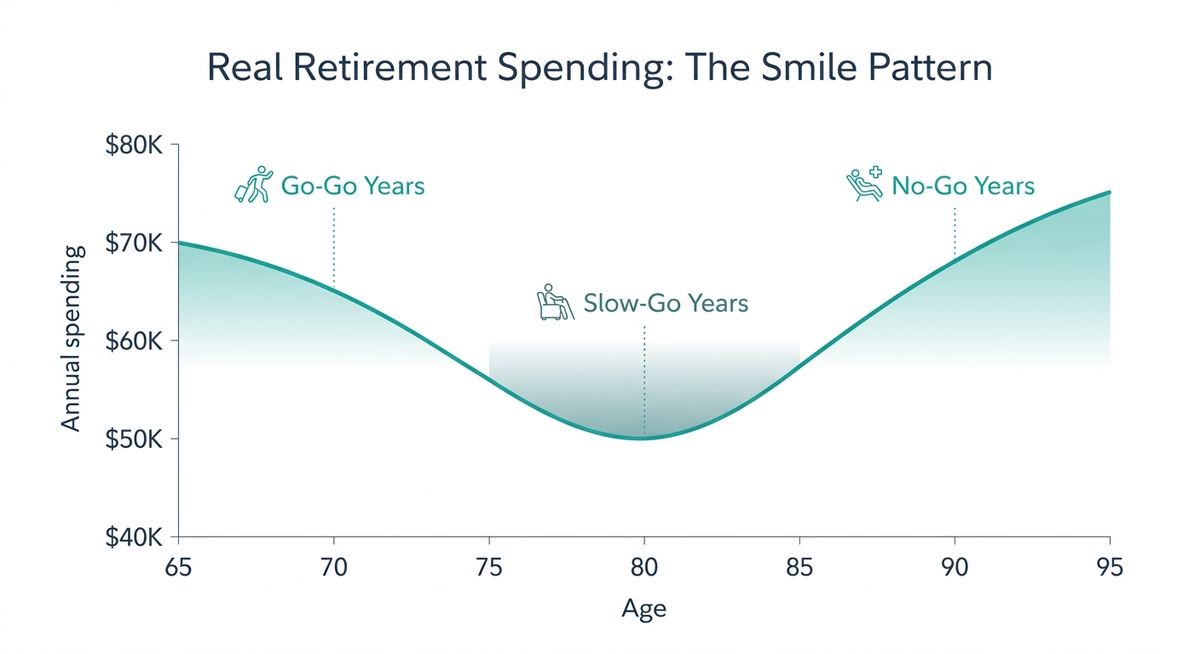
The Retirement Spending Smile
Go-Go years (65-75): Higher spending on travel, dining, hobbies
Slow-Go years (75-85): Natural spending decline as activity decreases
No-Go years (85+): Spending spike due to healthcare and long-term care
This creates two problems with flat-rate calculators. First, they may tell active early retirees they can't afford a lifestyle they could actually sustain for a few years. Second, and this is the bigger deal, they completely miss that late-life healthcare spending spike that can destroy a plan that looked solid on paper.
Retirement spending isn't a straight line. Any tool that treats it as one is giving you a fiction.
5. The Tax Surprise That Could Cost You Thousands Every Year
This one is sneaky. Most retirement calculators treat your savings as if every dollar is yours to spend. But if the bulk of your retirement savings sits in a traditional 401(k) or IRA, every withdrawal is taxed as ordinary income. Depending on your total income, tax bracket, and state of residence, you could lose 20% to 30% of every dollar you pull out.
That alone can swing retirement projections by $200,000 or more over a 25-year retirement.
And here's the part nobody tells you. Taxes get more complicated over time, not less. Required Minimum Distributions (RMDs) start at age 73 under SECURE 2.0, rising to age 75 in 2033. Once RMDs kick in, they can push you into higher tax brackets, increase your Medicare premiums through IRMAA surcharges, and trigger taxation on up to 85% of your Social Security benefits. These cascading effects can cost retirees thousands of dollars per year that no simple calculator anticipates.
Understanding why 84% of retirees make critical RMD mistakes becomes essential when these distributions can trigger such significant tax consequences.
Meanwhile, SECURE 2.0 has also eliminated RMDs on Roth 401(k)s and introduced new catch-up contribution rules. These create real opportunities, but only if your planning tool actually accounts for them. The tax code will keep evolving. If your plan can't model how different account types, withdrawal sequences, and bracket thresholds interact, it's basically giving you a pre-tax number and calling it a plan.
Smart Roth conversion strategies can dramatically reduce this tax burden, but most calculators don't model these opportunities at all.
Most calculators don't model tax brackets at all. They don't distinguish between Roth and traditional accounts. They ignore state income taxes entirely. If you're withdrawing $80,000 per year from your 401(k), the difference between a tax-aware plan and a tax-blind one could be tens of thousands of dollars annually.
That's real money. Your money.
What Actually Works: Stress-Testing Your Retirement
So if simple calculators are broken, what should you use instead?
The answer isn't a better single number. It's a better process. And honestly, it's not as complicated as it sounds.
Chance of Success simulation is the gold standard, and I promise it's simpler than the name makes it sound. Think of it like a weather forecast. A basic calculator tells you "it will be 72 degrees on your retirement date." Chance of Success runs hundres or more simulations using different combinations of market returns, inflation, and timing. Instead of one answer, it gives you a range of outcomes and the probability of each. "There's an 87% chance your money lasts to age 95, but a 13% chance you run short."
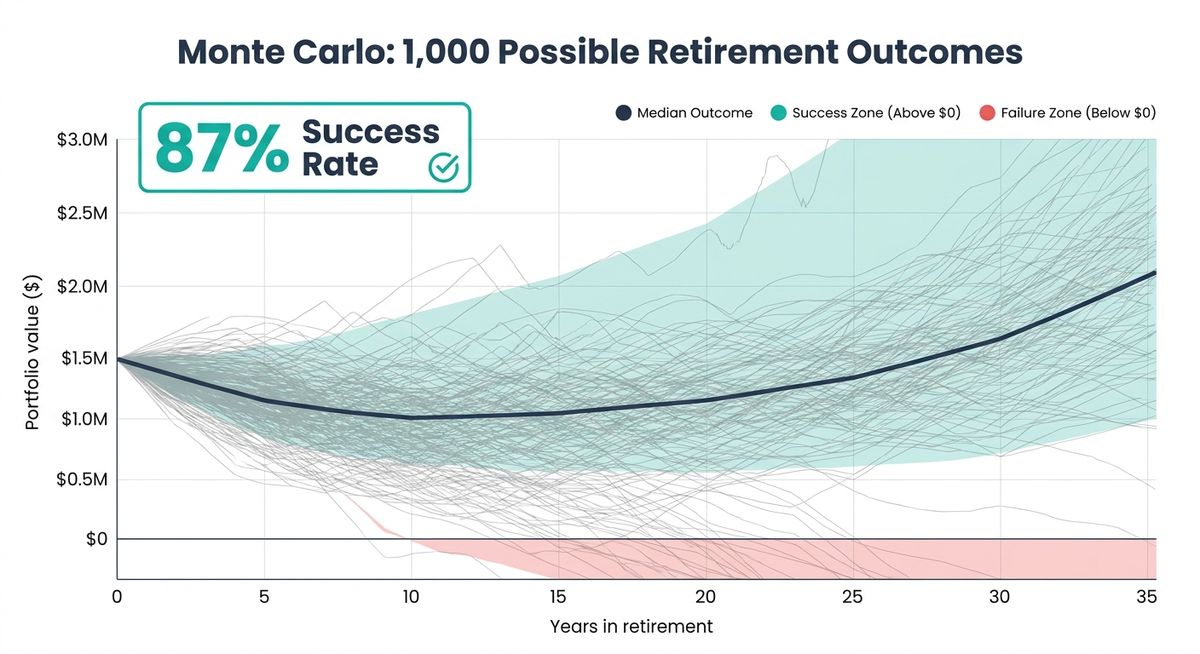
That 13% matters. It's the difference between confidence and false confidence.
Stress-testing takes this further. What happens to your plan if the market drops 40% in your first year of retirement? What if inflation runs at 5% for a decade? What if you need long-term care at 80? A good retirement plan doesn't just survive the average scenario. It survives the rough ones too.
Dynamic withdrawal strategies add another layer of resilience. Instead of rigidly pulling 4% every year (a rule that even its creator, William Bengen, has revised upward to 4.7% based on broader portfolio diversification), you adjust based on market conditions. Spend a bit more in good years. Pull back in bad ones. Keep two to three years of expenses in cash so you never have to sell stocks during a downturn. Research shows that guardrail-based approaches, where you set upper and lower spending thresholds and adjust only when you hit them, can dramatically improve how long your portfolio lasts. Morningstar's 2026 analysis found that flexible withdrawal strategies could push a safe starting rate as high as 5.7%, compared to 3.9% for rigid fixed withdrawals.
This is why the 4% rule is broken in 2026 and why dynamic approaches work better in today's environment.
That's a huge difference. And it comes from simply being willing to adapt.
Building a Retirement Plan That Actually Holds Up
Here's what a real retirement planning process looks like. And yeah, it takes more effort than plugging numbers into a website for 30 seconds. But we're talking about the rest of your life here. It's worth the extra work.
🎯 How to Build a Retirement Plan That Actually Works
- Start with your actual spending. Not 80% of your income. Your real expenses, category by category, with realistic estimates for healthcare inflation. Track what you actually spend for a month or two.
- Model multiple scenarios. What if the market is flat for 15 years? What if you retire into a recession? What if your spouse needs memory care at 82? Plan for reality, not averages.
- Account for taxes. Model how RMDs, Social Security taxation, IRMAA surcharges, and your mix of Roth versus traditional accounts will affect your withdrawals over time.
- Plan for the spending smile. Budget more for early retirement activities, less for the middle years, and build a reserve for late-life healthcare costs.
- Use a tool that shows ranges, not single numbers. You don't need false precision. You need to understand the boundaries of your financial future.
If you're planning your own retirement and want to see how your plan holds up under real-world conditions, try the our retirement planner. It lets you stress-test different scenarios, model variable spending, and see year-by-year projections instead of a single pass/fail grade.
Because retirement is too important to trust to a calculator that can't even agree with itself.
Thanks for reading if you've made it this far. Peace!