

Holistic retirement timeline

See your whole financial life, from today to the end of your plan, in one clear view

Retirement planning isn't just about a single number or a single year. It's about how everything fits together over time.

Ready Aim Retire's Holistic Timeline brings your income, expenses, assets, liabilities, taxes, benefits and the moments that matter to you into one timeline, so you can clearly see how today's decisions affect tomorrow's outcomes.

No spreadsheets. No guesswork. Just clarity.

Start Planning
Your whole retirement on one timeline, in 26 seconds, on Chris and Jamie's example plan.
Withdrawal strategy chart showing pre-tax, tax-free, and taxable withdrawals over time
Data summary panel showing net worth, contributions, market data, and special items Retirement portfolio growth chart with key metrics and chance of success

Milestones

Name the moments that matter

Retirement isn't a straight line. There's the kitchen you keep putting off, the big trip, the year you decide to slow down. Milestones put those moments on your charts as small flags.

A milestone can be:

  • An age: "Downsize at 70", for you or your spouse
  • A goal your savings reach: "portfolio reaches $2 million"
  • A line they fall below: a backup plan if savings drop under $1.5 million

Add up to five of your own. They sit beside the automatic ones, like Medicare, required minimum distributions, Social Security and a paid-off mortgage. Your Summary lists the next five coming up.
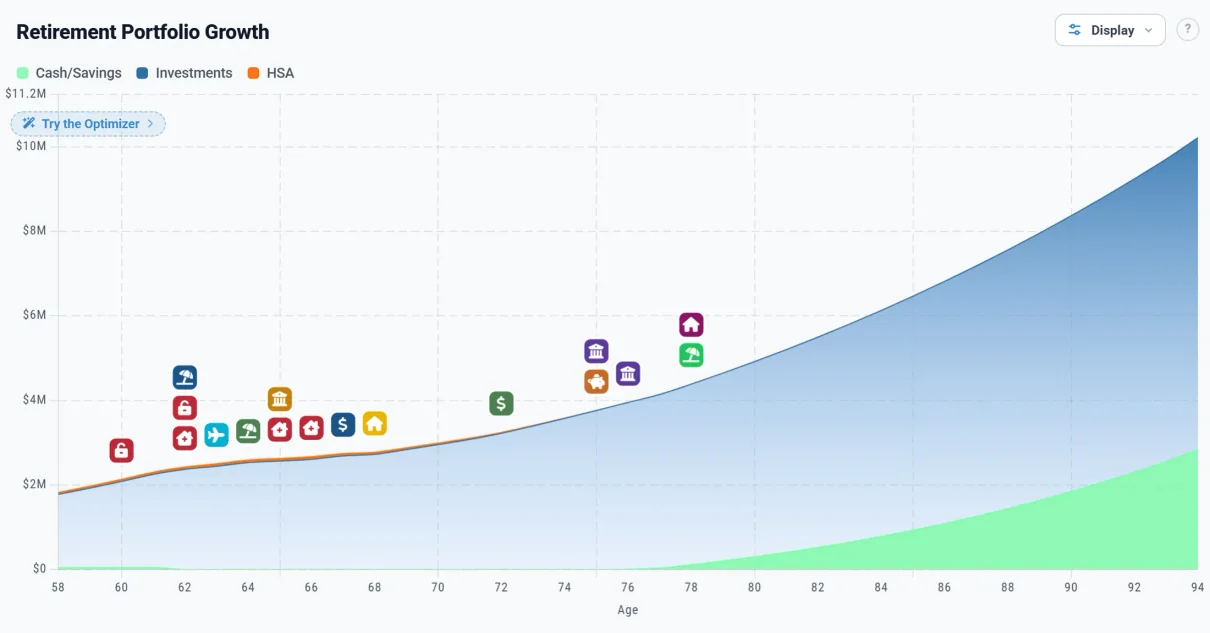
The Retirement Portfolio Growth chart from age 58 to 94 with a flag at every milestone: their own, a trip to Japan, a new kitchen and slowing down at 78, and automatic ones like Medicare and Social Security

Chris and Jamie's Portfolio chart, with their own milestones and the automatic ones. They are a made-up couple, 58 and 56.
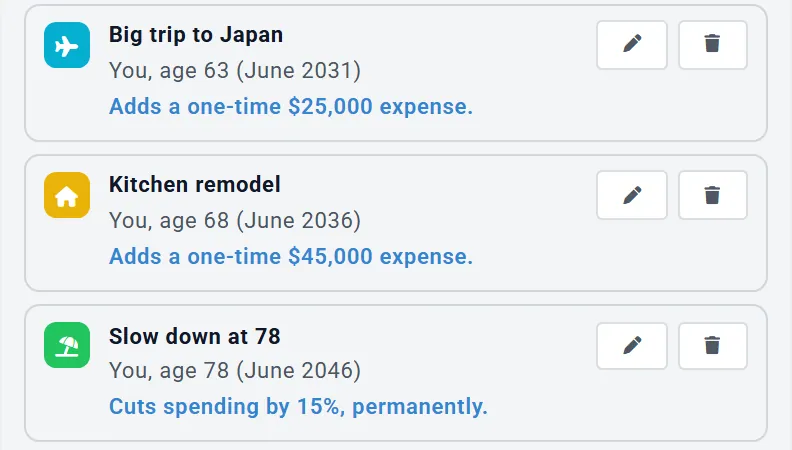
Three milestones in the Milestones box: Big trip to Japan, age 63, adds a one-time $25,000 expense; Kitchen remodel, age 68, adds a one-time $45,000 expense; Slow down at 78, cuts spending by 15%, permanently

Three of Chris and Jamie's milestones, each with an action.

Milestones with Planner+

Let a moment change the plan

Give a milestone an action, and your plan changes from the month it happens. A box under the fields says in plain words what will happen.

A milestone can:

  • Add an expense, once or every year for a while
  • Cut your spending by a percent
  • Start part-time income
  • Bring in a lump of cash, for example when you downsize

Pensions, income, one-time benefits, your paycheck and budget rows can also start or stop at a milestone, and move with it when you change it. And on any account, Chance of Success shows how often a goal is reached across market history, or how often a backup plan is needed, and at what age.

"What can we spend?"

What one more year of work is worth

Under your monthly spending, one link opens a table: your retirement age and the ages around it, each with the most your plan can spend every month, in today's dollars.

For each age, you see:

  • The most you could spend each month without your plan running out
  • How that compares with retiring at the age you planned
  • A Use this link that applies the age and the spending together

It works when you plan with one monthly amount, without a linked budget or guardrails. For a couple, both retirement ages move together. Each amount spends your savings down to almost nothing at the returns you entered, so check your Chance of Success after you use one.
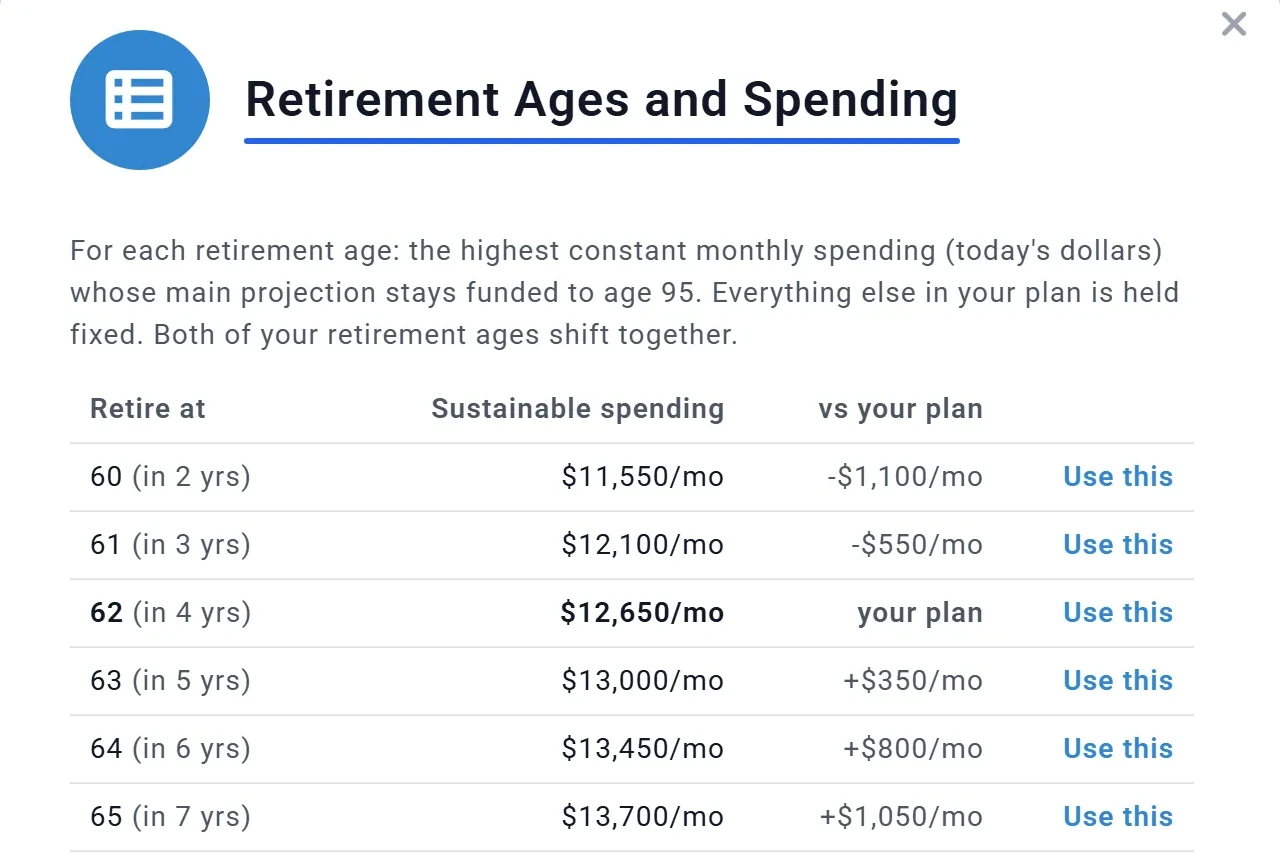
Retirement Ages and Spending: for each retirement age from 60 to 65, the highest monthly spending in today's dollars whose main projection stays funded to age 95, from $11,550 a month at 60 to $13,700 at 65, against $12,650 at the planned age of 62, with a Use this link on every row

Chris and Jamie's table: working to 65 instead of 62 adds $1,050 a month.
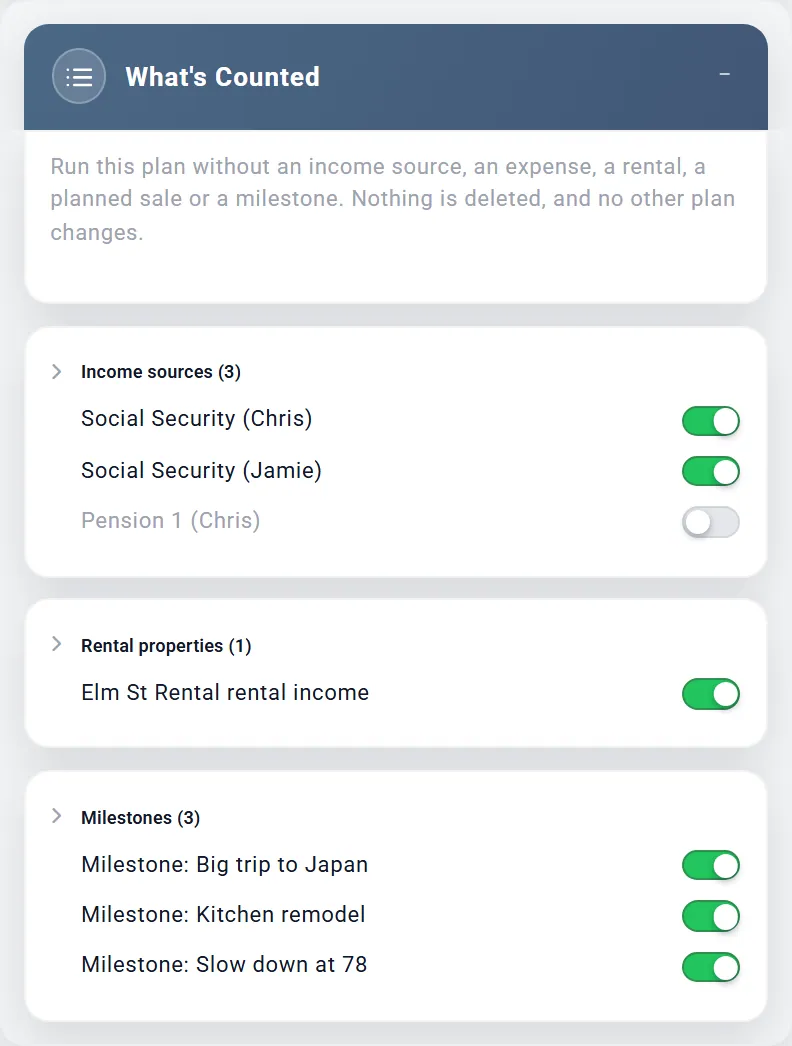
The What's Counted box: income sources with Social Security for Chris and Jamie switched on and Pension 1 for Chris switched off, the Elm St Rental's rental income, and three milestones, each with its own switch

Chris and Jamie's plan, with Chris's pension switched off.

What's Counted

See what one piece is really worth

What is the pension worth? The rent from the rental? The backup plan? Switch it off in one plan and see. The plan runs as if it were not there. Nothing is deleted, and no other plan changes.

You can leave out:

  • Income sources, such as a pension
  • Expenses
  • A rental's income, or a planned sale
  • A milestone

Your Dashboard shows a note while anything is left out, with a Restore button. What's Counted works on any account, including a Preview account.

Compare Plans

Your what-ifs, side by side

Your Master Plan is your best guess, the baseline. With Planner+, copy it, change one thing, and any difference in the results comes from that one change. Retire a year later, sell the rental, plan for an inheritance or a wedding.

Compare Plans puts up to three plans next to each other:

  • A scoreboard of the numbers that matter, with each plan's difference from the first
  • One chart that overlays them all: net worth, portfolio, withdrawals or taxes
  • Today's dollars or future dollars

Every plan runs on your current account balances, so the differences come from each plan's own choices. Nothing in any plan changes. Chance of Success isn't part of the comparison: open each plan to see its own. See a worked example
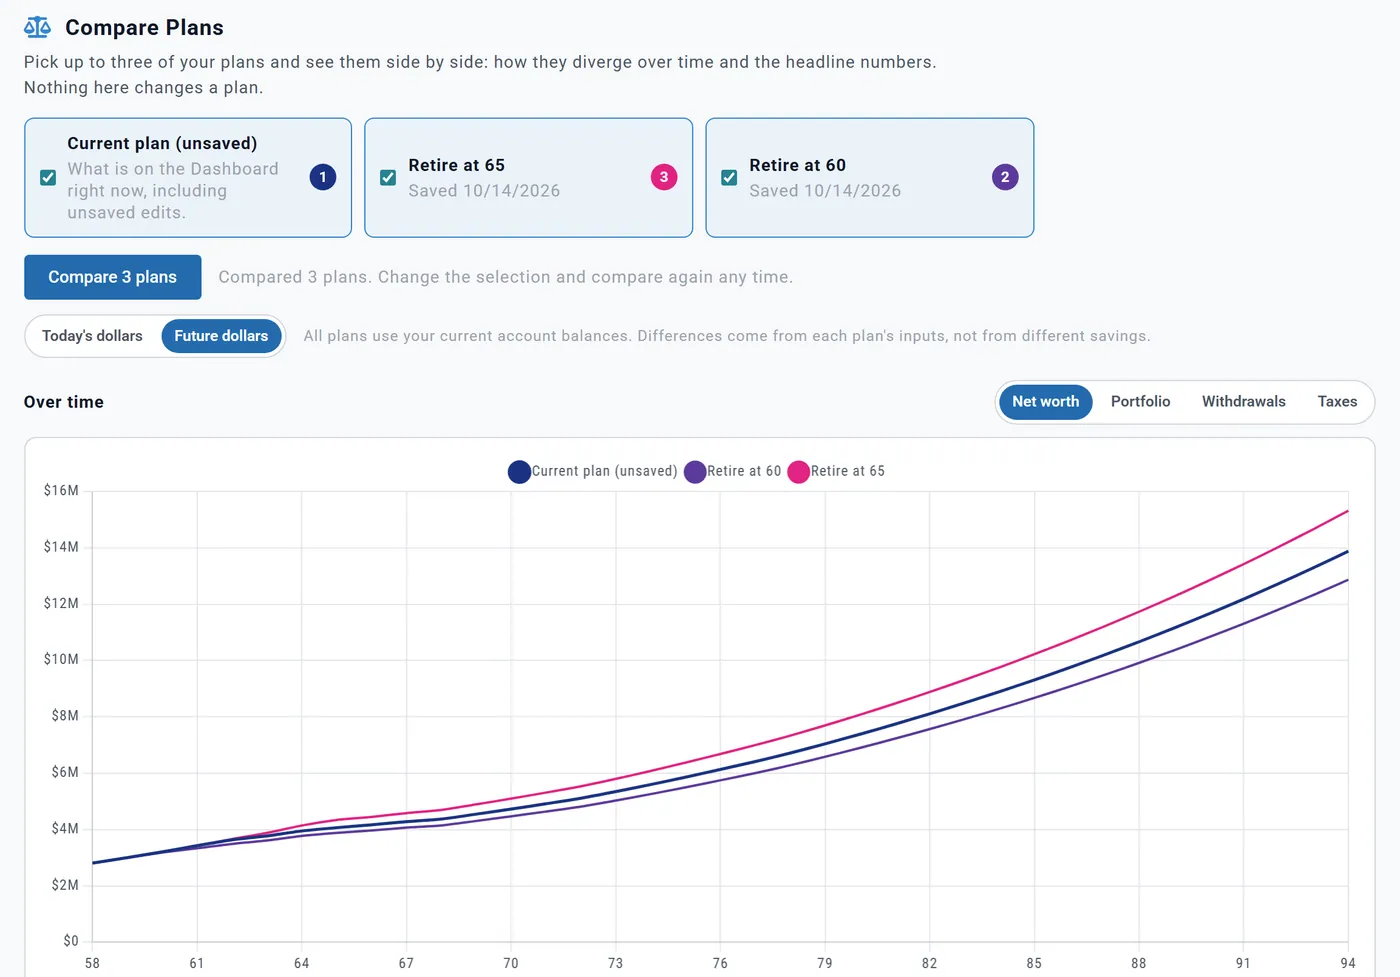
Compare Plans with three plans ticked, the current plan, Retire at 60 and Retire at 65, and a net worth chart from age 58 to 94 with one line for each plan

Chris and Jamie's current plan against retiring at 60 and at 65.

One timeline. Every moving piece.

Your financial life doesn't happen in isolation. The Holistic Timeline shows how all of these elements work together:

  • Your paycheck and raises, stepping down to part-time, or a year off
  • Retirement dates for each of you, and part-time work after
  • Social Security and pensions
  • Investment growth and withdrawals, account by account
  • Taxes and tax-efficient strategies
  • Living expenses and retirement budgets
  • Major life events: buying or selling a home, travel, health care
  • Assets and liabilities, including mortgages and loans

Everything is laid out year by year, so you can see the full story, not just snapshots.

Understand when things happen, not just what happens

Many retirement plans look fine on paper but fall apart when timing is off.

The Holistic Timeline helps you understand:

  • When income starts and stops
  • When expenses rise or fall
  • When assets are drawn down
  • When taxes increase or decrease
  • When benefits kick in

Read your charts by age or by calendar year, so the figures line up with your tax documents.

Test "what-if" scenarios

With Planner+, the What If chart tests one change at a time, without changing or saving your plan.

What happens if you:

  • Retire up to three years earlier or later?
  • Claim Social Security at any age from 62 to 70?
  • Spend up to 15% less, or 15% more?
  • Earn lower or higher stock returns, or face different inflation?

And for a market downturn early in retirement, Chance of Success replays the real ones.

Spot risks before they become problems

Because everything is shown together, potential issues become obvious:

  • Cash-flow gaps
  • Years with unusually high taxes
  • Large withdrawals early in retirement
  • Debt lingering too long into retirement
  • A warning flag where savings or an HSA run out

Instead of reacting later, you can adjust now, while you still have options.

Designed to be powerful, and easy to use

You don't need to be a financial expert to understand your timeline.

The interface is built to:

  • Be visual, with a flag on every event that matters
  • Use plain language instead of jargon
  • Show any year in detail with one click on its bar
  • Pair every chart with its own table, where a number explains how it was worked out

Plain words up front, and the math one click away.

Free to get started, then add Planner+

A Preview account gives you the Portfolio chart and its table, your milestones on it, and What's Counted.

Planner+ adds:

  • Every other chart and table, from Net Worth to Cash Flow
  • Milestones that change your plan
  • Copies of your plan for what-ifs
  • Compare Plans, up to three side by side

See plans and pricing

Preview Free to get started

  • The Portfolio chart and its table, with every milestone on it
  • Your own milestones, at an age or when your savings cross an amount
  • Milestone Outcomes in Chance of Success, for milestones that watch your savings
  • What's Counted: switch a pension, a rental or a milestone off in your plan

Planner+ Planner+ adds

  • Every other chart and table: Net Worth, Withdrawals, Taxes, Income, Spending, Cash Flow, What If and more
  • Milestones that act: add an expense, cut spending, start part-time income or bring in cash
  • Budget rows that start when a milestone's condition is met
  • More plans: copies of your Master Plan for each what-if
  • Compare Plans: up to three plans side by side
Want every detail? Read the full guide, Milestones, in our help center. Read the guide

See the big picture. Plan with confidence.

Every chart on your timeline shows one projection of your plan, at the returns and inflation you set. Real markets rise and fall around it, which is what Chance of Success is for. Ready Aim Retire is an educational tool, not financial advice.

It's free to get started. Upgrade to Planner+ when you're ready.

Explore & Learn

Take aim at your retirement
with Ready Aim Retire

Sign up today and start building the financial plan you deserve. It's free to get started!

Get Started