
Net Worth Tracking

See your financial progress, clearly and over time

Start Planning

Net worth is one of the clearest signs of financial health. It tells you where you stand today, how far you've come, and whether your retirement plan is actually working.

Ready Aim Retire puts it on the first page of your plan: what you're worth today, where it's headed to the end of your plan, and how it has moved since you started. Then it follows the money all the way to what your heirs would receive.
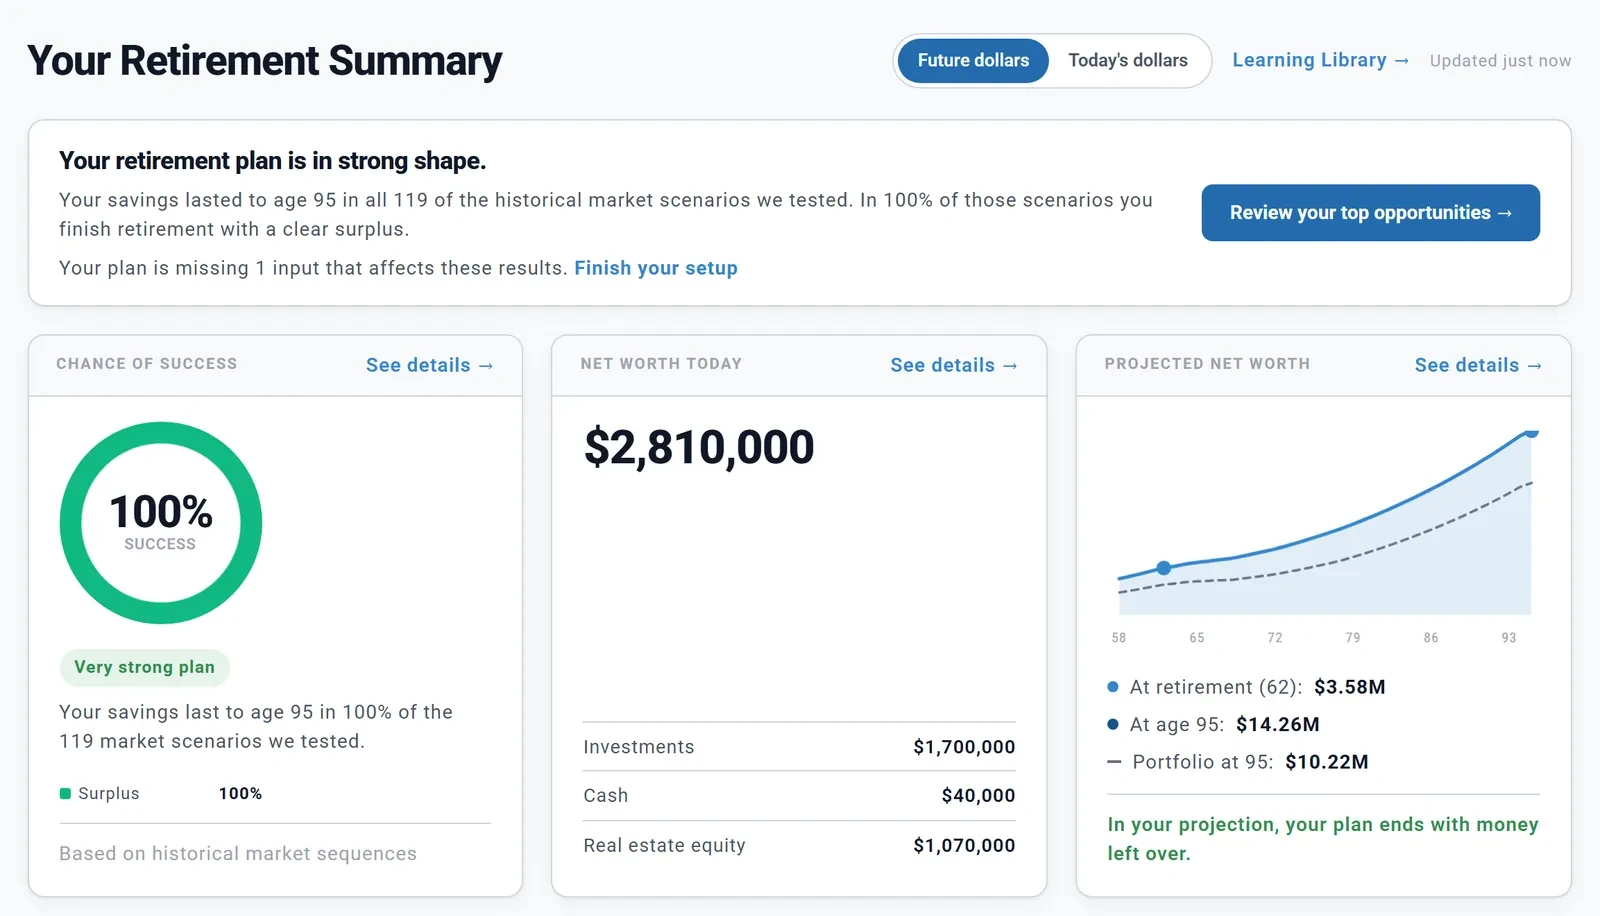
Your Retirement Summary: the verdict that the plan is in strong shape, then three cards: Chance of Success at 100%, Net worth today of $2,810,000 split into investments, cash and real estate equity, and Projected net worth rising to age 95
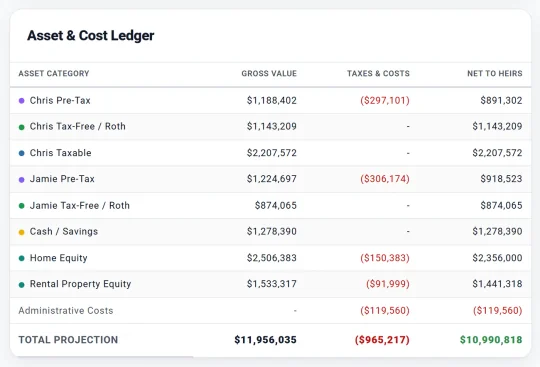
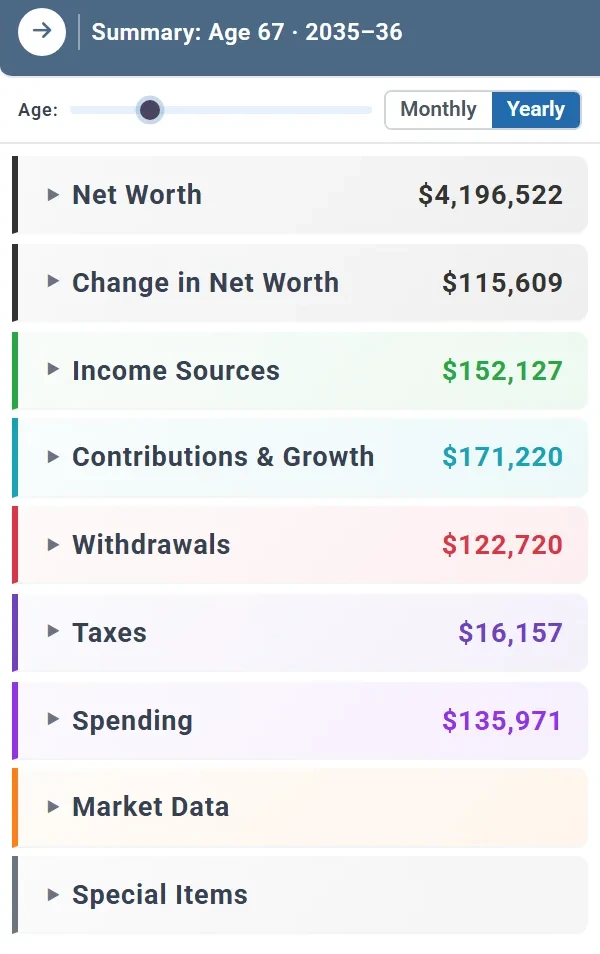
The Dashboard's summary panel for age 67: net worth $4,196,522, change in net worth $115,609, then income sources, contributions and growth, withdrawals, taxes and spending The Estate tab's Asset and Cost Ledger: each person's pre-tax, Roth and taxable money, cash, home and rental equity, with the taxes and costs on each, and $10,990,818 net to heirs

Today, any year, and the end: Chris and Jamie's Summary, their year at 67, and what their heirs would receive. Chris and Jamie are a made-up couple we use in our examples.

On your Summary

Today, and every year after

Open your plan and your net worth is near the top of the Summary, in two cards.

  • Net worth today: your investments, cash and real estate equity, plus other assets, annuity contracts, deferred compensation and debts when you have them
  • Projected net worth: a line from today to the end of your plan, with your savings alone as a dashed line beside it, and your net worth at retirement and at the end
  • If your savings would run out, an amber dot marks the age. Net worth that keeps rising after that is your home and other assets, not money you can spend

With Planner+, the Net Worth chart shows the same projection year by year: each person's accounts, your home and rental equity, and debts below zero. Point at any year to read every balance.
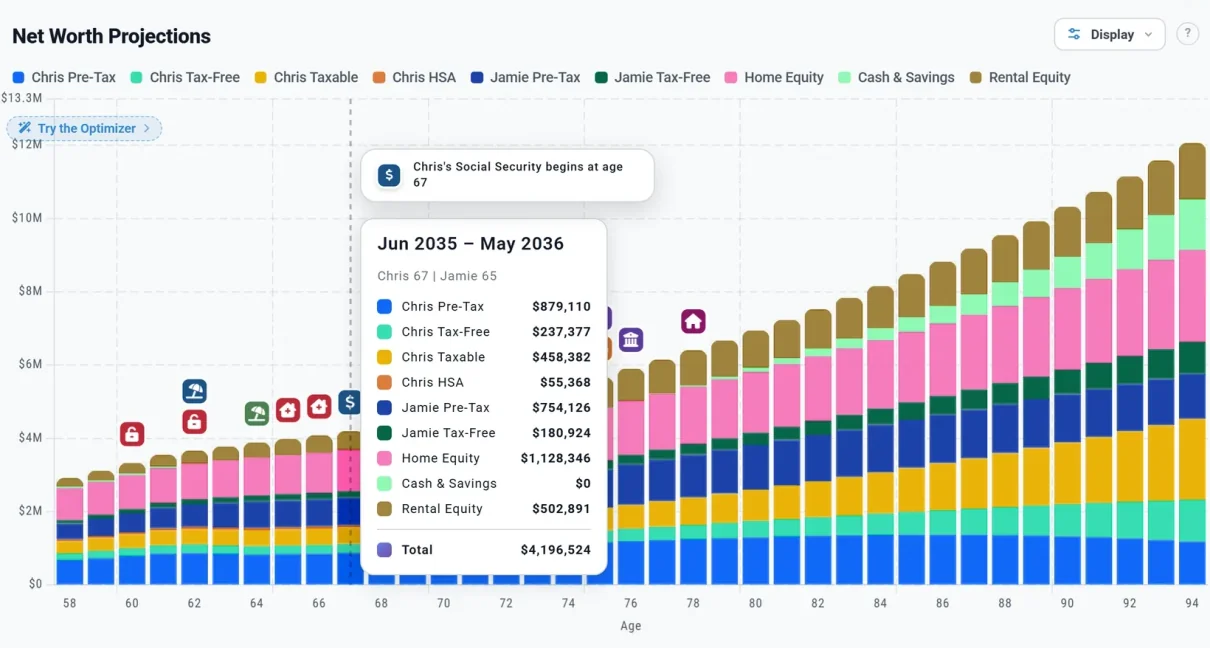
The Net Worth Projections chart from 58 to 94, a stacked bar for each year by account, home equity, cash and rental equity. The tooltip for June 2035 to May 2036, Chris 67 and Jamie 65, lists each balance and a total of $4,196,524.

The Net Worth chart at Chris's 67, the year his Social Security begins.
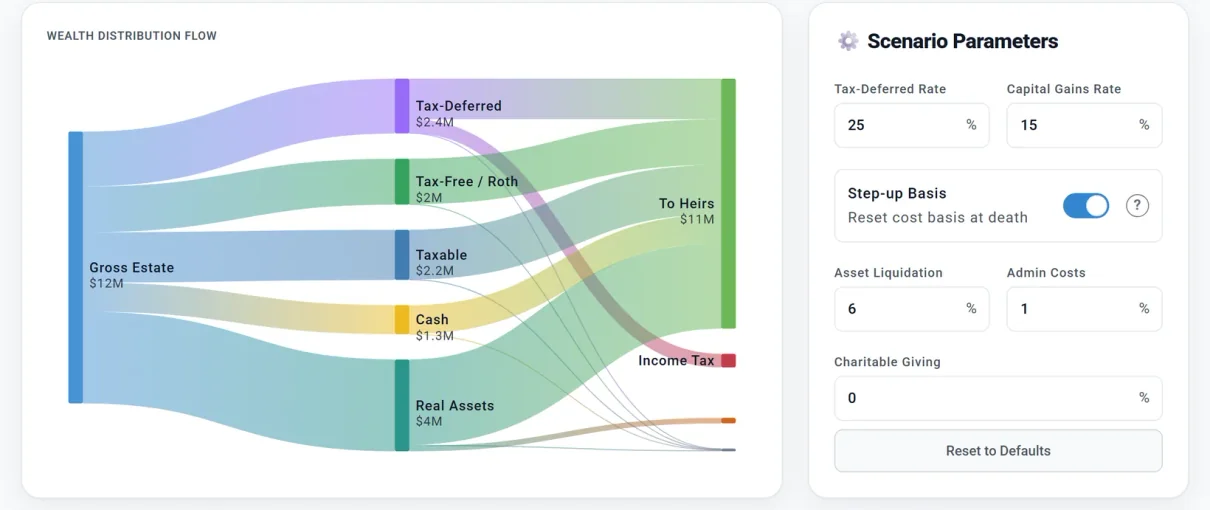
Wealth Distribution Flow: a gross estate of $12M splits into tax-deferred, Roth, taxable, cash and real assets, which flow to heirs ($11M) and a small income tax band. Beside it, Scenario Parameters: tax-deferred rate 25%, capital gains rate 15%, step-up basis on, asset liquidation 6%, admin costs 1%, charitable giving 0%.

Chris and Jamie's estate at the end of their plan, from gross estate to heirs.

The Estate Tab

What your heirs would receive

Your net worth at the end of the plan isn't what your heirs receive. The Estate tab starts from it and takes off the income tax your heirs will owe on pre-tax money, the cost of selling property and of settling the estate, and anything you leave to charity.

  • A flow chart from your gross estate, through each kind of asset, to your heirs and each cost
  • A ledger with each person's pre-tax, Roth and taxable money, your cash and property, and what each costs your heirs
  • Rates you can change, including the tax your heirs pay on pre-tax money, and a share for charity
  • Beneficiaries: name up to 15 people or organizations, and see each one's share

The tab works out income tax, not federal or state estate tax, and it says so. The same heirs' tax rate is how the Optimizer values pre-tax money left at the end.

Assets and liabilities, together

True net worth counts both sides of the balance sheet. Accounts & Assets keeps them in one place:

  • Investment and retirement accounts, and your HSA
  • Cash and savings
  • Your home, rentals and other assets
  • Mortgages, loans and other debts

The plan knows the difference: your home and other assets count in your net worth, while your investments, HSA and cash are what pay for retirement.

Understand the "why" behind the numbers

Net worth tracking isn't about chasing a number. It's about knowing what moves it.

  • Change in Net Worth shows each year's growth, property values and income above the line, and taxes and expenses below it
  • The summary panel beside any Dashboard chart lists one year's net worth, income, contributions, withdrawals, taxes and spending
  • Switch between today's dollars and future dollars to see the change in real terms

Every number, explained

Charts & Data puts the Net Worth chart above its table: one row a year, a column for each account, and each person's own total.

  • Click an underlined figure to see how it was worked out
  • "This year" shows a row's money in and out, start to finish
  • Export CSV opens in Excel, Numbers or Google Sheets

Integrated with your entire plan

Net worth doesn't live in isolation. It's the result of everything else.

  • It uses the same projection as your Dashboard, month by month
  • Your accounts are shared by every plan you make, so one updated balance updates them all
  • Contributions, withdrawals, taxes, home values and loans all flow into it

No duplicate data. No disconnected charts. Just one model.

Your numbers, typed by you

There is no bank linking. You enter each balance yourself on Accounts & Assets, and update it when you like. We never connect to your bank or brokerage.

Want it off our servers too? Privacy Mode keeps your plans, budgets and accounts only in the browser you're using.

Your balances stay exactly as you typed them until you change them.

Watch progress turn into confidence

Each day you update your accounts, the planner records that day's net worth as a Progress Point. Over time they become your history.

  • Net worth today shows the change since your last point
  • The Progress tab charts every point, and you can add one for a past date
  • With Planner+, the Progress card shows how far you've come since your first point, and tells you when your balances are over 30 days old

How you compare

Against households your age

The How you compare card on your Summary ranks your household's net worth, home included, against US households in your age group, with their median and average. The figures come from the Federal Reserve's Survey of Consumer Finances (2022, in today's dollars).

Chris and Jamie read "Wealthier than 88%" of US households aged 55 to 64. It's on US plans, open on a Preview account, and a click opens a guide on what the number means.

Community

Share it, anonymously

Any signed-in account can put its net worth on Community's Net Worth chart, under a nickname you choose. Others see your age and each account's type and balance, never account names or addresses.

Your entry stays up to date with your balances, and Unshare takes it off at any time. Your net worth appears there only if you choose to share it.

Preview Free to get started

  • Net worth today and Projected net worth on your Summary
  • How you compare, against US households your age
  • Updating your balances, and adding your home and rentals
  • Sharing your net worth on Community
  • The Portfolio chart, with its table and Export CSV on Charts & Data

Planner+ Planner+ adds

  • Adding your own investment and cash accounts, debts and other assets
  • The Net Worth and Change in Net Worth charts, with their tables and Export CSV
  • The Progress card on your Summary
  • The Estate tab, with your beneficiaries
Want every detail? Read the full guide, The Summary and the Coach, in our help center. Read the guide

Why net worth matters in retirement planning

Net worth connects your present reality to your future possibilities. Projected figures come from one projection at the returns and inflation you set, so real markets will make them differ, and the Estate tab is an estimate, not an estate plan. Ready Aim Retire is an educational tool, not financial, tax or legal advice.

Explore & Learn

Take aim at your retirement
with Ready Aim Retire

Sign up today and start building the financial plan you deserve. It's free to get started!

Get Started