

How Much Do I Need to Retire? Fidelity Says Save 10x Your Income by 67. Let Me Tell You What That Leaves Out.


You've seen the number. Save 10 times what you make by the time you're 67, and you're golden. It's clean, it fits on a bumper sticker, and it might be the most repeated line in all of personal finance. It's also only half the story.
- Fidelity's 10x-by-67 target assumes you save 15% starting at 25, stay over 50% in stocks, and only need the portfolio to cover ~45% of pre-retirement income — Social Security and other income cover the rest.
- Two dials move your real number: when you retire (8x at 70, 10x at 67, 12x at 65) and how you plan to spend (8x lean, 10x average, 12x+ big spending).
- Your replacement rate — the share of income you need to replace — swings from about 55% for high earners to 80% for those under $50,000, which the flat 10x figure hides.
- The rule ignores two major costs: roughly $172,500 in lifetime healthcare costs for a single 65-year-old, and a Social Security trust fund now projected to run dry around late 2032.
- Behind on savings? The fix depends on age: under 40, raise your savings rate and let compounding work; over 40, pull the contribution, spending, and retirement-age levers together.
Here's the thing almost nobody tells you: 10x is where the conversation starts, not where it ends. Your actual number might be 8x if you plan to live simple and clock a few more years at work. Or it might be 12x, maybe higher, if you want to bail early and see the world. And the one thing that decides where you land in that range? It isn't your income at all. It's something called your replacement rate, and depending on what you earn, it swings anywhere from 55% up to 80%.
So let's walk through it together. What Fidelity's rule actually says, the two dials that move your personal number, what folks have really got saved (spoiler: probably less than you'd guess), and the two big things the rule leaves out completely: healthcare and Social Security. By the time we're done, you'll know if your number is 8x, 10x, or 12x, and exactly what to do if you're running behind.
Where Fidelity's 10x number even comes from
Fidelity didn't pull 10x out of a hat. It's the finish line of a very specific set of assumptions, and honestly, the assumptions matter as much as the number.
The Model Figures You
- Start saving at 25
- Sock away at least 15% of your gross income every year, and that counts your employer's 401(k) match
- Keep more than half your portfolio in stocks, on average, across your whole working life
- Retire at 67, which is full Social Security age for anybody born in 1960 or later
- Plan for the money to last until you're 93
Do all that, and the portfolio is built to cover roughly 45% of your pretax, pre-retirement income. Social Security and whatever else you've got are supposed to pick up the rest. I want to underline that 45%, because it means your 10x pile was never designed to fund your whole retirement. It's one leg of a three-legged stool.
And here's a clarification that trips up basically everyone. My buddy Nick asked me this exact question over dinner last month. That 10x refers to your invested retirement savings, the stuff meant to spit out income. Your 401(k), your IRA, accounts like that. It does not count the equity in your house or an old-school pension. Those things can absolutely help carry you through retirement, but they sit outside the multiple. Which is why the target can look terrifying until you remember what it's actually measuring, and what it isn't.
To keep you on track across a 40-year haul, Fidelity chops the big goal into age-based check-ins. Think of them as mile markers on a road trip:
| By age | Savings target |
|---|---|
| 30 | 1x your income |
| 40 | 3x your income |
| 50 | 6x your income |
| 60 | 8x your income |
| 67 | 10x your income |
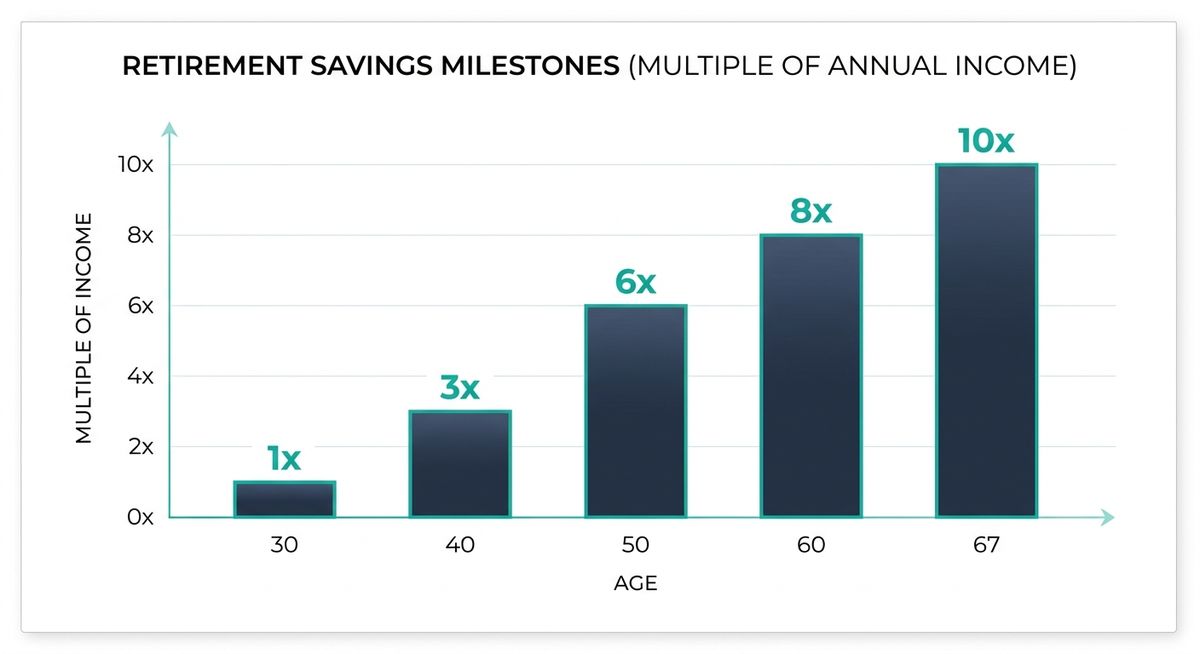
These are targets to aim at, not laws carved in stone. Miss one and you're not sunk, I promise. But they're handy because they take this big fuzzy someday goal and turn it into a check you can run in about ten seconds. Multiply your salary, look at your balance, and boom, you know roughly where you stand.
The two dials that move your number
Fidelity is upfront that there's no single number that works for everybody. Two things reshape your target more than anything else: when you quit working, and how you plan to live once you do.
Dial one: when you retire
The age you walk out the door changes the math three ways at the same time. Working longer gives your investments more runway to compound, cuts down the years you're pulling money out, and bumps your monthly Social Security check higher. All three push in the same direction, which is nice for once.
Retire at 65
- Target 12x income
Your money has to stretch further, so you need a bigger cushion.
Retire at 67
- Target 10x income
The baseline Fidelity target, tied to full Social Security age.
Retire at 70
- Target 8x income
Shorter timeline, Social Security maxed out.
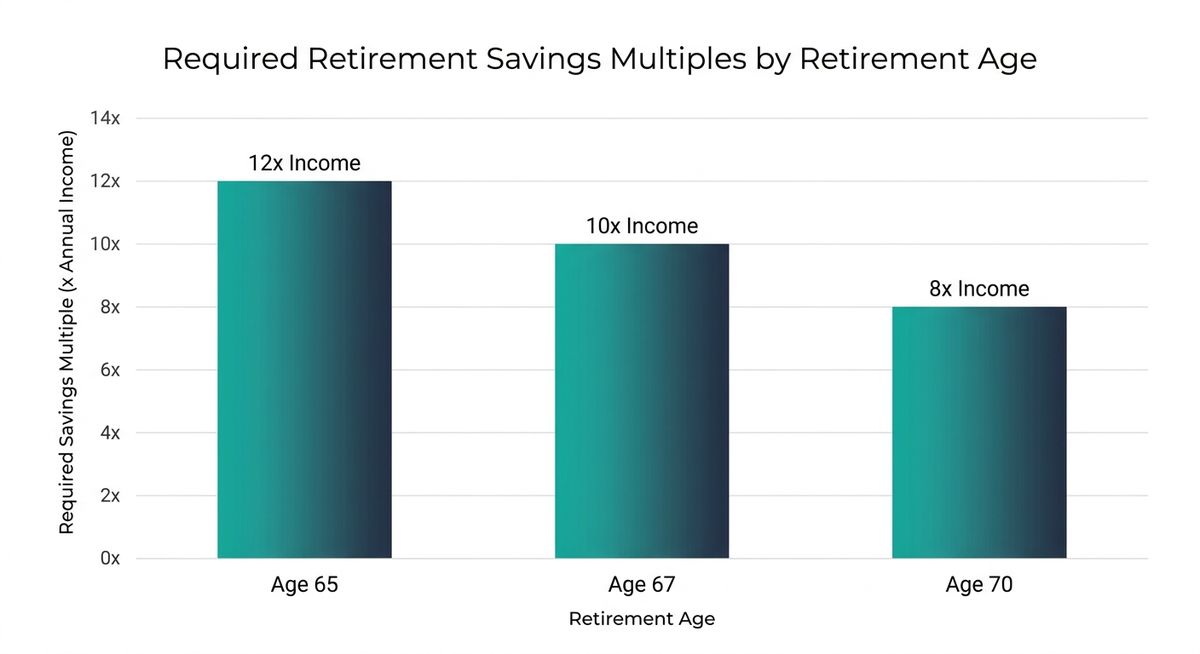
Read that again, because the gap is wild. The difference between hanging it up at 65 versus 70 is the difference between needing 12x and 8x. On a $100,000 income, that's $1.2 million versus $800,000. Five more years of work can move your target by $400,000. That's not pocket change. If you want the exact target for your specific age, we've broken down how much you need whether you retire at 55, 60, 65, or 70.
Dial two: how you plan to live
Your number also has to match how you're going to spend once the paychecks stop showing up.
Below-Average Spending
- Target ~8x
Planning to downsize the house, move somewhere cheaper, or just live lean? Your 67 target slides down.
Average Spending
- Target 10x
Want to keep your current life humming along about the same? You stay parked at the baseline.
Above-Average Spending
- Target 12x+
Globe-trotting, expensive hobbies, or leveling up your lifestyle? Plan for more.
Stack both dials together and you get the real picture. A frugal person retiring at 70 might genuinely be fine at 8x. A big spender heading out early at 65 could be looking at 14x or more. The 10x headline is just the middle of a pretty wide range, and your job is to find your own spot on it.
The hidden variable: your replacement rate
Okay, here's the part almost every article about the 10x rule skips right over, and it might be the most useful thing you read all day.
Remember that 45%-from-savings figure? That's an average. And averages love to hide the good stuff. How much income you actually need to replace leans hard on what you earn right now, because of two forces working at the same time.
A 25-Point Spread Hiding Behind One Guideline
Fidelity's own research shows somebody earning under $50,000 might need to replace roughly 80% of their pre-retirement income, while somebody pulling in $200,000 might need only about 55%.
Why the gap? Lower earners spend a much bigger chunk of every paycheck on the basics. Rent, groceries, gas. There just isn't much fluff to trim once they retire. They also get a higher replacement rate from Social Security, because the benefit formula is built to favor lower earners on purpose. Higher earners are the mirror image. Less of their income goes to necessities, Social Security replaces a smaller slice of their check, and they've got to self-fund way more of their own retirement. But they need a lower overall percentage to keep their life feeling the same.
So here's the practical move: run the multiplier, then adjust for your income. If you earn $200,000, the plain 10x rule might actually overshoot the percentage you really need. If you earn $45,000, you're going to lean hard on Social Security to hit that 80%. Which, as we'll get to in a minute, is exactly the income that's most exposed to future benefit cuts. Keep that one in your back pocket.
Every retirement plan is different, and your income is just one input in the equation. ReadyAimRetire lets you test how these adjustments play out with your specific numbers, instead of just eyeballing where you land on that 55% to 80% range.
A reality check, and why you shouldn't lose sleep
If those milestones feel a mile away right now, you've got plenty of company. The gap between the target and real life is wide, and I think it actually helps to look at it straight on.
According to Fidelity's Q4 2025 numbers, the average 401(k) balance is $146,400. But the median is just $34,400. The median is the more honest "typical" number here, because a handful of giant accounts yank the average way up. Break it down by generation and you can see a lifetime of compounding doing its thing:
| Generation | Average 401(k) balance |
|---|---|
| Baby Boomers | ~$260,300 |
| Gen X | ~$215,600 |
| Millennials | ~$82,600 |
| Gen Z | ~$18,000 |
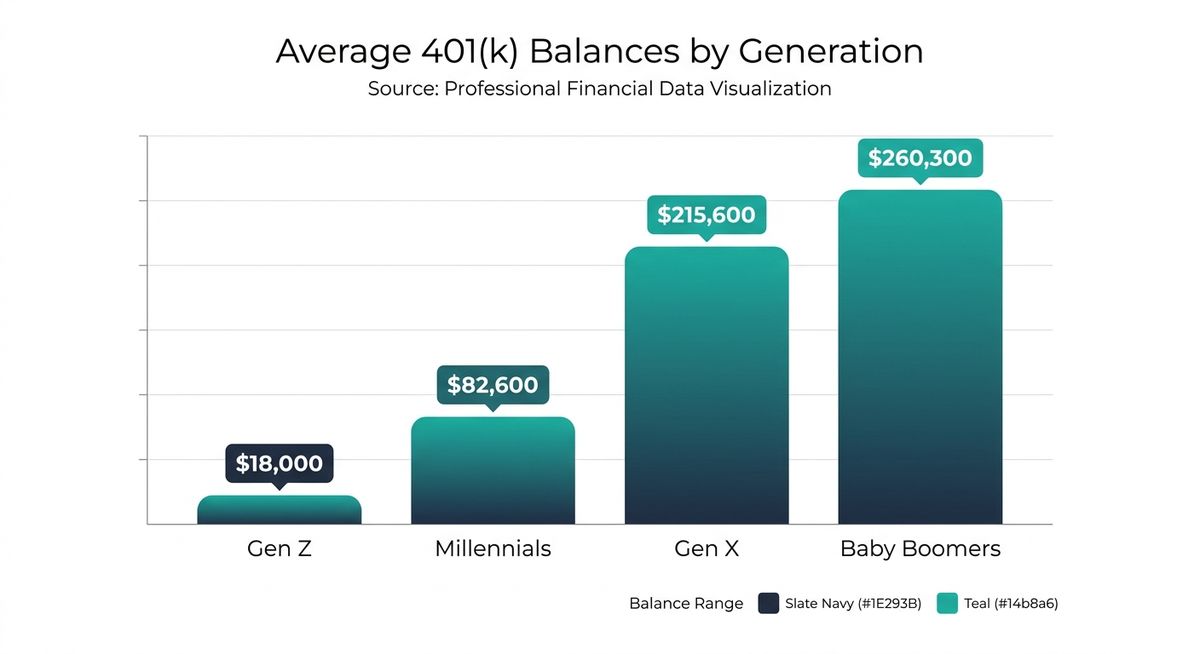
The Federal Reserve puts median retirement savings for households aged 55 to 64 at roughly $185,000. On a $100,000 salary, the 8x-by-60 target is $800,000. So most folks walking up to retirement are nowhere close.
So why not panic? Because Fidelity's own fine print calls these things "hypothetical illustrations" that "do not take into consideration the specific situation of any particular user." And the critics push it even further.
"Fixed income multiples completely ignore what you actually spend in a year... plenty of successful retirees have far less saved than Fidelity recommends and still retire just fine." — Rubino & Liang Wealth Partners
Their whole point: the benchmark can breed a bunch of unnecessary gloom if you treat it like a pass-fail test instead of a compass. A better question than "did I hit my multiple?" is "does the income I expect cover the spending I expect?"
And that question comes with its own rule of thumb: 25x your yearly spending, which is really just the flip side of a 4% withdrawal rate. Figure you'll spend $60,000 a year and it points you at a $1.5 million target, versus the $1 million the 10x rule hands a $100,000 earner. The two can drift apart because they're built on different assumptions. The 25x-expenses version assumes your portfolio covers all your spending. The 10x-income version assumes Social Security covers about half. To reconcile them, subtract your expected Social Security benefit before you apply the 25x. That little move is exactly what turns a rule of thumb into an actual plan. It's one of several rules of thumb worth knowing before you settle on a number, since each one is built on different assumptions than Fidelity's 10x model.
Use the milestones to find your direction. Don't use them to grade yourself.
Saving it up is only half the game
Getting to your number is the accumulation phase. Spending it down without running dry is the decumulation phase, and it matters every bit as much. A big balance handled carelessly can still leave you in a bad spot.
Fidelity figures a sustainable withdrawal rate is no more than 4% to 5% of your portfolio in that first year of retirement, with the dollar amount ticking up each year to keep pace with inflation. On a $1 million portfolio, that first year is $40,000 to $50,000, on top of whatever Social Security sends you.
But this is one of those areas where the smart people flat-out disagree, and you deserve to know the range.
Bill Bengen (2025)
- First-year draw on $1M $47,000
- Safe withdrawal rate 4.7%
The planner who invented the original 4% rule now bases this on a more diversified portfolio than his old 50/50 mix. He argues some early retirees are "cheating themselves" by pulling out too little, while warning inflation is the retiree's "greatest enemy."
Morningstar (2026)
- Time horizon 30 years
- Safe withdrawal rate 3.9%
A forward-looking view built on projected returns instead of historical ones. Even this number has crept up, from 3.7% the year before.
So the honest guidance is a range with a trend, not one magic number. Somewhere between 3.9% and 4.7% is defensible, the safe rate has been nudged upward across the board lately, and where you land depends on your time horizon, your mix of assets, and how comfortable you are trimming your spending when the market has a rough year. You can run these numbers for your own situation at ReadyAimRetire.com to see how a withdrawal rate at either end of that range changes your monthly income over a 30-year retirement. If you want the full case for why the old 4% rule doesn't fit 2026 anymore, we dig into the math behind these updated withdrawal rates here.
The two costs the 10x rule quietly ignores
Two big expenses sit almost entirely outside that neat little 10x box, and ignoring them is exactly how confident plans fall apart.
Healthcare
$172,500 in Lifetime Medical Costs
A single 65-year-old retiring in 2025 can expect roughly this much in lifetime medical costs — up 4.5% from $165,000 the year before. For a couple, it's about $345,000. That figure leaves out long-term care, which can absolutely dwarf it.
If you retire before 65, you've also got to buy your own health insurance until Medicare kicks in, and that out-of-pocket gap can run you several years. And once Medicare does kick in, the Medicare Supplement decision is its own six-figure swing, so it's worth getting right.
Social Security
A Projected 22% Cut, Around Late 2032
Remember, the model expects Social Security and other income to cover that roughly 55% your portfolio doesn't. Well, that leg of the stool is under some strain. The Social Security retirement trust fund is now projected to run dry around late 2032. After that, unless Congress steps in, incoming payroll taxes would only cover about 78% of scheduled benefits — an estimated cut of roughly 22%, or around $500 a month for a typical beneficiary.
And notice that date keeps moving, and not in a comforting direction. Last year's Trustees Report said depletion in early 2033. The 2026 report pulled it forward to late 2032, partly because a 2025 tax law trimmed the revenue Social Security collects by taxing benefits. Nobody knows what Congress will finally do here. But planning as if Social Security will hand you 100% of today's promised benefit is, let's say, optimistic. And this risk lands hardest on lower earners, the very same people who need to replace 80% of their income and lean on the program the most. None of this is a reason to panic and claim early out of fear, either. When you claim still matters more than most people think, since grabbing benefits early locks in a smaller check for life.
If you're behind, here's the game plan
Fidelity's clearest piece of advice is not to freak out if you're short of your nearest milestone. It's to do something about it, and the right move depends on your age.
If You're Under 40
Time is your biggest asset, hands down. Bump up your savings rate, even by a single percent, and let compounding carry the load over the decades. One percentage point today can turn into a serious pile by 67. Make sure your portfolio is actually built to grow, with a diversified mix tilted toward stocks.
If You're Over 40
Your compounding runway is shorter, so one lever won't cut it. Pull three at once: crank up your contributions, take an honest look at your current spending and trim what you can, and seriously think about pushing retirement back a few years, which can drop your target from 10x toward 8x.
The tax code hands older savers some extra room, and the 2026 limits are pretty generous:
| 2026 limit | Amount |
|---|---|
| 401(k) employee deferral | $24,500 (up from $23,500) |
| Age-50 catch-up | $8,000 (total: $32,500) |
| Age 60–63 "super catch-up" (SECURE 2.0) | $11,250 (total: up to $35,750) |
Heads up: the super catch-up replaces the regular catch-up, it doesn't stack on top of it.
One Rule Change to Plan Around
Starting in 2026, workers 50 and up who earned more than $150,000 the prior year have to make their catch-up contributions Roth, meaning after-tax. That shifts the tax timing, so build it into your strategy instead of getting blindsided by it.
Your next three moves
The 10x rule earns its fame because it takes a giant, scary question and turns it into a ten-second gut check. Just don't confuse the gut check for the full diagnosis.
Here's How to Actually Put This to Work Today
- Find your real multiple. Start at 10x, then adjust. Retiring early or planning to spend big? Slide toward 12x. Retiring at 70 or living lean? You might be just fine at 8x. Then sanity-check it against your income, because high earners often need a lower percentage and lower earners a higher one.
- Stress-test the two hidden costs. Add a line for healthcare, at least $172,500 for a single retiree, and pressure-test your plan against a Social Security benefit that could be about 22% smaller after 2032. If your plan survives both of those, now you've got a real plan.
- Pull one lever this week. Bump your contribution rate by 1%, or 2% if you're over 40. If you're 50-plus, grab the catch-up. If you're 60 to 63, grab the super catch-up. The best time to close the gap was at 25. The second best time is your next paycheck.
Start by modeling your retirement at ReadyAimRetire to see where your real number falls before you touch a single contribution setting.
The multiple gets you into the ballpark. The adjustments are what get you all the way home.
Thanks for reading if you made it this far. Now go bump that contribution rate. Peace!