

Are You Behind on Your 401(k)? Savings Targets and Playbooks by Age (2026 Edition)


My friend Sarah called me last spring, genuinely rattled. She's 47, sharp as anyone I know, and she'd just logged into her 401(k) to find $52,000 sitting there. Then she did what we all do. She Googled "average 401(k) balance by age," found the median for her bracket sitting at $78,730, and decided she was years behind.
She wasn't. Not even close.
Because Sarah also has $88,000 in a rollover IRA from the job she left back in 2019, plus another $31,000 parked at an employer she'd honestly forgotten about until I made her dig through old emails. Her actual household retirement total? $171,000. More than double the Vanguard median she'd spent the whole evening panicking over.
She lost a night of sleep to a number that was never built to describe her.
This is the single most common mistake people make when they try to figure out where they stand. And here's the annoying part: almost every article written about 401(k) savings targets makes it worse, not better. So before we get to the benchmarks and the playbooks, let's fix the measuring tape.
- Vanguard's 2026 median 401(k) balance is $44,115 overall, but that figure counts one account at one employer — it understates most consistent savers badly.
- Add up every account (old 401(k)s, rollover IRAs, spousal accounts) and count Social Security before comparing yourself to any benchmark.
- The 4% withdrawal rule isn't 4% anymore — researchers now range from 3.9% to 5.5%, a swing worth hundreds of thousands of dollars on the same nest egg.
- Catch-up contributions became mandatorily Roth for high earners on January 1, 2026, if your prior-year Social Security wages topped $150,000.
- If you're over 50 with $100,000 saved, an extra $500 a month is worth roughly $158,000 by 65. The window isn't closed.
Bottom line: stop comparing your 401(k) balance to a median built from other people's slices. Total your accounts, count Social Security, then check the playbook for your age.
The numbers everyone is searching for: Vanguard's 2026 401(k) balances by age
Vanguard's How America Saves 2026 just dropped. It's the 25th edition, covering roughly 4.6 million participants, with data current as of December 31, 2025. Balances hit records pretty much across the board.
| Age | Median balance | Average balance | What the gap tells you |
|---|---|---|---|
| Under 25 | $2,234 | $7,259 | Average is 3.2× the median |
| 25-34 | $18,732 | $50,261 | 2.7× |
| 35-44 | $46,919 | $120,742 | 2.6× |
| 45-54 | $78,730 | $214,991 | 2.7× |
| 55-64 | $107,269 | $305,006 | 2.8× |
| 65+ | $103,202 | $330,186 | 3.2× |
| All participants | $44,115 | $167,970 | 3.8× |
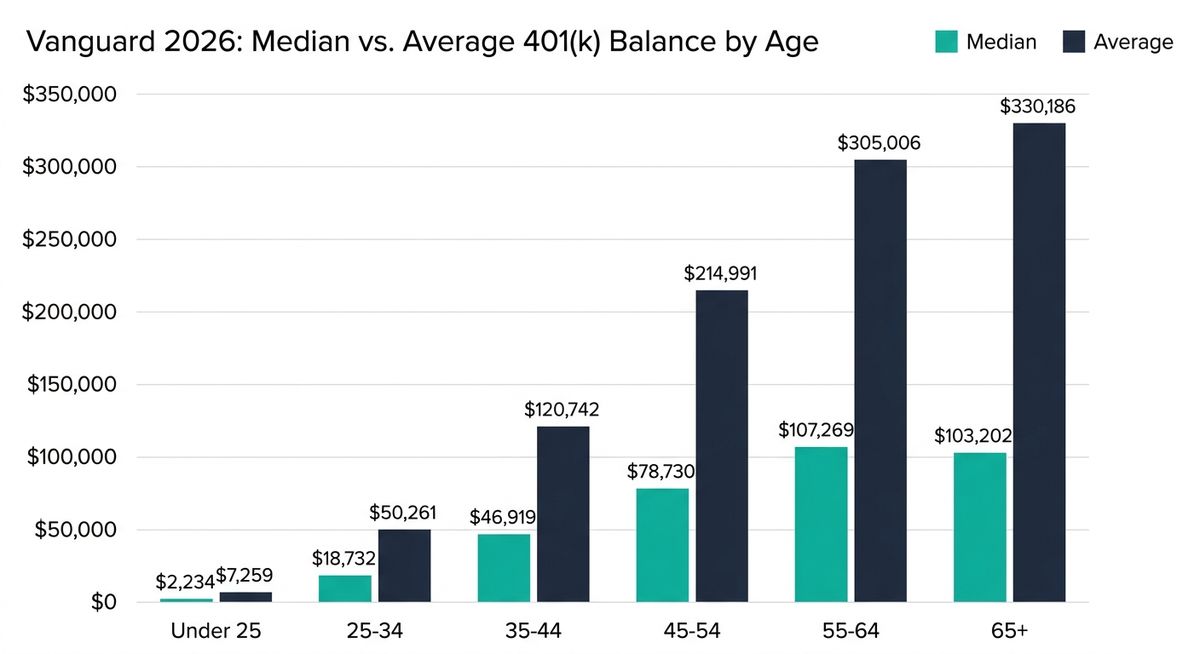
That $167,970 overall average is the headline you'll see quoted everywhere for the next six months. Here's what nobody mentions: it sits at roughly the 75th percentile. Which means about three out of four participants have less than "average." Only 10% of people have $250,000 or more, and that top 10% averages $549,281.
So yes, use the median. Just understand what the median is actually counting, because it's counting a lot less than you think.
Why the median 401(k) understates almost everyone
The Vanguard median is one account, at one employer, at one moment in time. That's it. Three separate forces push it below what a consistent saver actually piles up.
Job Changes Scatter Your Money Around
The average American switches employers roughly a dozen times over a career. EBRI tracked 2.7 million "consistent participants" who stayed in the same plan from 2019 through 2023 — their average balance grew from $82,274 to $148,092, a 15.8% compound annual growth rate. That group held roughly twice the average and four times the median of the broader database.
Fidelity found the same thing coming at it from a different angle: their five-year continuous participants average $304,200, versus $155,800 for everybody.
Auto-enrollment drags the median down, mechanically. Vanguard's participation rate hit 86%, up from 65% a quarter century ago. Sixty-one percent of plans now auto-enroll, and that climbs to 79% at large employers. SECURE 2.0's mandate means most newly created plans don't even get a say. So every single year, millions of near-zero accounts pile into the denominator.
Picture my nephew's buddy, a 26-year-old auto-enrolled at 4% back in March with $1,100 in his account. He's a success story. Five years ago he would have saved exactly nothing. He also drags the median down.
A flat or falling median is not proof that people are saving less. It can be proof that plan design is working.
That one fact changes how you should read that table up there.
A household is not an account. The Federal Reserve's Survey of Consumer Finances, still reporting 2022 data, puts median retirement savings for households aged 55-64 at $185,000. That's about 1.7× Vanguard's single-account figure of $107,269. The Fed counts IRAs, spousal accounts, forgotten old plans. Vanguard counts one 401(k). And since the Fed's snapshot is three years older than Vanguard's, that gap is probably wider today, not narrower.
The Real Problem This Doesn't Solve
Now, I'm not going to sit here and tell you everything is fine. The same Fed data shows roughly 46% of American families hold no retirement account at all, and those folks don't appear in the Vanguard table anywhere. That's a real problem and it deserves more than a paragraph.
But if you have a 401(k) and you're comparing its balance to a median, you're comparing a slice of your assets to a statistic built from slices of other people's assets. You're probably scaring yourself for no good reason.
A better way to check your retirement savings
Here's the three-step version that actually reflects your life.
Step one: add up everything. Current 401(k). Old 401(k)s. Rollover IRAs. Roth IRAs. Your spouse's accounts. Any pension present value. HSA money you've earmarked for retirement. That total is your number. And if you genuinely can't find an old plan, the Department of Labor's abandoned plan database and the national Retirement Savings Lost and Found registry are both free. Took my man David about twenty minutes to surface a plan he'd written off entirely.
Step two: count Social Security. This is the variable that almost all "you're behind" math conveniently leaves out, and it's enormous. The average retired worker benefit hit about $2,086 a month in July 2026. Call it $25,000 a year, after the 2.8% COLA for 2026. Social Security replaces roughly 40% of a typical worker's pre-retirement income, and the replacement rate is progressive, so lower earners get proportionally more of their income covered.
The Math That Actually Changes
Divide a $70,000 spending target by 4% and you get an intimidating $1.75 million. Terrifying number. But a household with two average benefits is already covering $50,000 of that $70,000. The portfolio only has to produce the other $20,000. At a 3.9% withdrawal rate, that's about $513,000. Not $1.75 million. Same household, same lifestyle, one honest adjustment.
Step three: use a multiple that adjusts for who you actually are. Fidelity's famous guideline (1× salary by 30, 3× by 40, 6× by 50, 8× by 60, 10× by 67) is easy to remember, and to their credit, Fidelity calls it aspirational themselves. T. Rowe Price's 2026 benchmarks are more useful because they actually flex:
- Age 30: about 0.5× salary
- Age 35: 1× to 1.5×
- Age 50: 3.5× to 5.5×
- Age 60: 6× to 10.5×
- Age 65: 7.5× to 13×
Married dual-income couples land at the low end. Single filers and high earners land at the high end, precisely because Social Security replaces less of a high earner's income. If you've been measuring yourself against one flat multiple, you've been chasing somebody else's target this whole time.
The 4% rule is not 4% anymore
Every by-age article divides a balance by 25 and calls the result your retirement income. The arithmetic is fine. The premise expired.
The safe withdrawal consensus split apart in 2026, and nobody serious is standing on exactly 4% anymore:
- Morningstar (February 2026): 3.9% for a 30-year horizon with 30-50% equity, up from 3.7%. Their series has bounced almost every year: 3.3% in 2021, then 3.8%, 4.0%, 3.7%, 3.7%, now 3.9%.
- Morningstar with flexible spending or guardrails: up to 5.7%.
- Bill Bengen, the guy who invented the rule, now publishes 4.7%. And that figure is a worst-case floor drawn from an October 1968 retiree, not a recommendation. Asked what he'd actually tell a retiree sitting across from him today, Bengen says 5.25% to 5.5%.
The spread matters way more than any single number. To fund $50,000 a year from a portfolio:
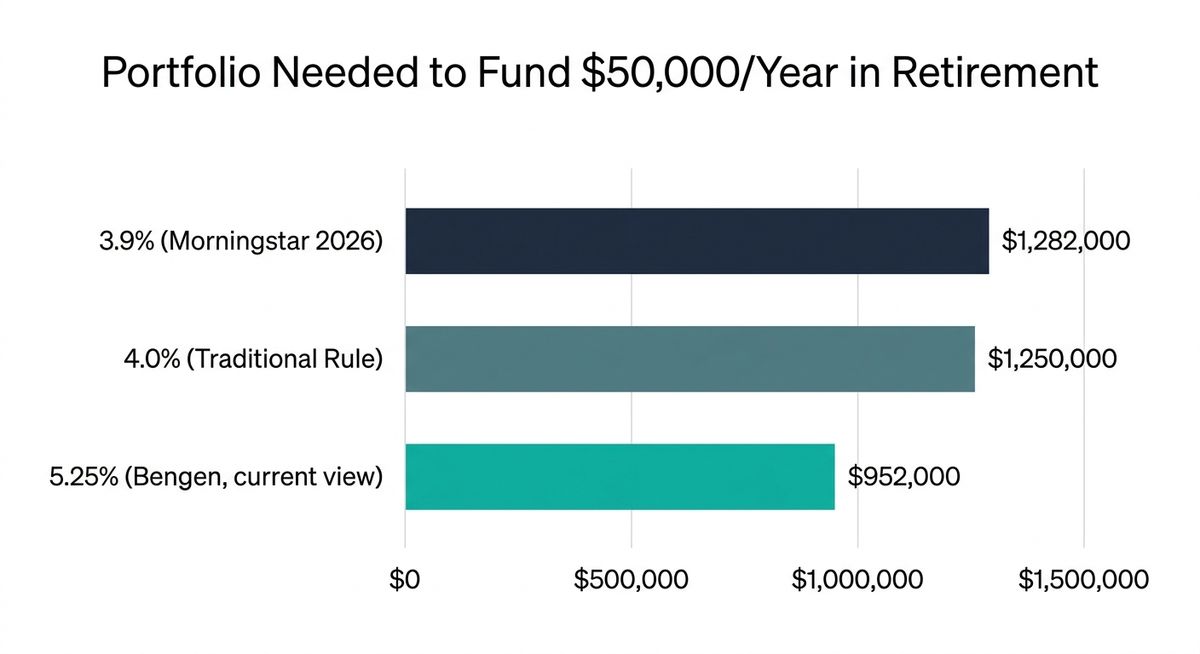
That's a $330,000 swing driven entirely by which researcher you happened to read that morning. Which is exactly why the rule is a planning tool, not a verdict.
Sequence-of-Returns Risk
There's a catch buried in the good news, though. Morningstar's researchers flagged that today's mix of high equity valuations and below-average bond yields makes sequence-of-returns risk unusually severe for anyone retiring right now. Wade Pfau's research found the first ten years of retirement explain roughly 77% of the final outcome. Two retirees can both average 7% over 30 years. The one who catches the bad years first, while drawing money out, can run out. The one who catches them last never even notices.
The reason your statement looks great in 2026 is the same reason your withdrawal rate should stay conservative. Those two facts aren't in tension. They're the same fact.
The playbooks: your 401(k) savings targets by age
Under 35: buy time, because you can't buy it later
Median balances: $2,234 under 25, $18,732 for ages 25-34. Low balances here are normal. Not a failure, not a character flaw.
- Enroll on day one. If there's no plan at work, open an IRA at Vanguard, Fidelity, or Schwab. The 2026 IRA limit is $7,500.
- Contribute a percentage, not a dollar amount. Percentages ride along with every raise automatically. Dollar amounts just sit there getting smaller in real terms.
- Capture the full employer match. Vanguard's average employer contribution hit a record 4.7% of pay. Now, to be straight with you: matched dollars are a one-time boost on the dollars you put in, not some magical annualized return. But it's still the only guaranteed money in your plan.
- Use a target-date index fund. Sixty-one percent of Vanguard participants hold a single target-date fund, and 96% of plans offer one. It handles diversification and rebalancing without you ever touching it.
- Do nothing dramatic. Only 5% of Vanguard participants traded at all last year. That's not apathy. That's a feature.
35-44: automate the increases
Median $46,919, average $120,742. Earnings climb in this decade. So do weddings, mortgages, and daycare bills that could fund a small country.
- Push total contributions to 12%-15% of pay, including the employer match. Vanguard's all-time-high total contribution rate is 12.1% average, 11.6% median. Hit 15% and you're meaningfully ahead of the pack.
- Turn on auto-escalation. Seventy-one percent of plans offer it now. Here's the stat that gets me: 45% of participants raised their savings rate last year, but only 14% actually chose to. The other 31% got escalated automatically and never had to make a decision. The people who succeed at this mostly aren't more disciplined than you. They just set it once and went back to their lives.
- Split raises 70/30. Seventy percent to savings and debt, 30% to stuff you actually enjoy. The Bogleheads veterans give a blunter version: save half of every raise. Both work. Pick the one you'll stick with.
- Grow your income. Expenses have a floor. Income doesn't.
45-54: nail down your 401(k) savings target
Median $78,730, average $214,991. This is where peak earnings collide with peak obligations. Mortgage, teenagers, aging parents, all at once.
- Get to 15%+ total. If your household number is under $200,000 at 50, go higher than that.
- Find your crossover point. That's the portfolio value where a safe withdrawal plus Social Security covers your spending. Take your annual spending, subtract expected Social Security, divide what's left by 0.039 for a conservative target or 0.05 for an aggressive one. That range is your honest answer.
- Consolidate old accounts now, while you can still remember where you worked. Bonus: it makes Step One above take ten minutes instead of an entire weekend.
- Add health care as its own line item. Fidelity's 2026 estimate is $185,500 for a single 65-year-old, up 7.5% year over year. Or $371,000 for a couple, which is just that figure doubled. It assumes Original Medicare plus Part D, and it leaves out long-term care entirely.
55-64: the catch-up window, and the rule that just changed
Median $107,269, average $305,006. At a 3.9% withdrawal rate, the median single account throws off about $4,180 a year. Please read that as one piece of a household plan sitting alongside roughly $25,000 of Social Security. Not as a life sentence.
| 2026 | |
|---|---|
| Employee deferral | $24,500 |
| Catch-up, age 50+ | $8,000 |
| Super catch-up, ages 60-63 | $11,250 |
| Total, age 50+ | $32,500 |
| Total, ages 60-63 | $35,750 |
Two things people consistently get wrong here. First, the super catch-up replaces the $8,000, it doesn't stack on top of it. And it's a four-year window that slams shut at 64. Your plan also has to offer it, since it's optional. Net effect: a 60-year-old can shelter $3,250 more per year than a 59-year-old, about $13,000 of extra room across the whole window.
Correction Worth Flagging
The 2026 IRA catch-up is $1,100, not $8,000. Several sites have this wrong. Don't build a plan on it.
Now here's the rule almost nobody is writing about: catch-up contributions became mandatorily Roth for high earners on January 1, 2026. Treasury and the IRS issued final regulations on September 16, 2025, implementing SECURE 2.0 §603. If your prior-year Social Security wages from the employer sponsoring your plan cleared the threshold (for 2026, more than $150,000 in Box 3 of your 2025 W-2), every catch-up dollar has to go in as Roth. The regs are formally applicable in 2027, with good-faith compliance expected now, so some plans are further along than others.
What This Looks Like in Real Life
Think about a 58-year-old earning $180,000 who's maxed pre-tax catch-ups for eight straight years. She saw her withholding change in January and her taxable income go up. She did nothing wrong. The law changed underneath her. Plan for the bigger current-year tax bill, and then give yourself credit for the offset: that $8,000 now grows and comes out tax-free, and it won't inflate the income that drives her Medicare premiums down the road. Because the test uses wages from that specific employer, self-employment and multi-employer situations work differently. Worth a conversation with a tax preparer, not a blog post.
Also in this decade: design your decumulation strategy. Withdrawal order across taxable, traditional, and Roth accounts, plus when you claim Social Security, is where real money gets won or lost. And calibrate your risk. A portfolio that's correct for a 45-year-old is not correct five years from your exit date.
65 and older: turn capital into income
Median $103,202, average $330,186. That median dip versus the 55-64 bracket reflects withdrawals starting up, not some market failure.
- Know your baseline burn. Housing, Medicare premiums, out-of-pocket health costs, food, transportation. The stuff that shows up whether you want it to or not.
- Know your RMD age. It's 73 if you were born between 1951 and 1959, and 75 if you were born in 1960 or later. There's no phase-in, no gentle slope. December 31, 1959 gets 73. January 1, 1960 gets 75. Those extra two years are prime Roth conversion territory.
- Watch the IRMAA cliffs. Medicare premium surcharges are based on your income from two years prior, and they step up at hard thresholds. One large traditional withdrawal or conversion can raise your premiums for a full year. Plan withdrawals to the top of a bracket, not one dollar past it.
- Give yourself credit for costs that disappear. No commute. No work wardrobe. No retirement contributions. If you were saving at that 12.1% average total rate, that alone cuts the income you need to replace.
- Consider phased retirement. Part-time or consulting income for two or three years is one of the most effective defenses against sequence risk there is, because it lets the portfolio keep compounding while you draw less out of it.
- Spend on purpose. The account was always a means to something. Don't forget what.
The confidence paradox, and what to do this week
Here's 2026 in one juxtaposition. Balances set records. And EBRI's 2026 Retirement Confidence Survey, fielded in January across a general-population sample of 2,052 Americans, found overall confidence fell to 64%. Worker confidence dropped six points to 61%, and 65% of workers named debt as a problem.
A record statement doesn't produce security when your monthly cash flow is strained.
So if you feel behind despite decent numbers, that gap is real and a lot of people are feeling it with you. It usually points at debt and cash flow, not at your investment mix.
So: are you behind on your 401(k) savings targets? You can't answer that from the table at the top of this article. You can answer it from four things.
🎯 What to Do This Week
- Total every retirement account you own, including your spouse's and the ones you forgot about. Compare that number to any benchmark. Not your 401(k) balance.
- Pull your Social Security statement at ssa.gov and subtract that income from your target before you calculate what the portfolio has to cover.
- Turn on auto-escalation at 1% a year. It's the single highest-leverage click available to you, and the data says it beats deliberate choice by more than two to one.
- If you're over 50 and your 2025 W-2 showed more than $150,000 in Social Security wages, call your plan administrator and confirm how your catch-up is being coded this year.
And if the honest answer is that yes, you're behind? The window isn't closed. At age 50 with $100,000 saved, contributing $300 a month gets you to roughly $380,000 by 65. Contributing $800 a month gets you to roughly $538,000. That $500-a-month decision is worth about $158,000 in nominal dollars, assuming 7% annual returns.
And it's still fully available for you to make. Today, this week, whenever you get around to it. Just get around to it.
Thanks for reading if you've made it this far. Peace!
Sources: IRS catch-up contributions · Morningstar 2026 SWR · Quarles: Roth catch-up 2026 · SSA average benefit · Kiplinger: average check July 2026 · CNBC: Fidelity health costs · EBRI RCS 2026 · Vanguard 25th HAS press release · Money: Bengen update · Congress.gov: RMD rules