

When Saving More Makes You Poorer: How to Find Your 401(k) Inflection Point


A quick note on the headline before we start: the original draft called this "Here's EXACTLY When You Can Stop Saving," in all caps, which is a promise this article doesn't keep. I'm not telling you to stop saving. I'm telling you to point the money somewhere else. Different thing.
Here's something nobody in your financial life is ever going to say to you: "Hey, you can ease up now."
And I get why. Your custodian makes money on the assets you hold with them. Your 401(k) recordkeeper gets paid based on how big the plan is. Your HR department has a participation number they're graded on. And financial media? Financial media sells worry. "You're behind" gets clicks. "You're probably fine" doesn't. I've watched this play out for twenty years.
Nobody has ever launched a product called You Can Stop Now. So the question never comes up, and a bunch of genuinely successful people spend their last decade of work grinding away at a number that quit meaning anything a long time ago. This is what oversaving for retirement actually looks like: not recklessness, just no signal telling you to stop.
And the research backs this up in a way I find kind of heartbreaking. EBRI looked at how retirees actually spend their money and found that households with $200,000 to $500,000 in savings (not counting the house) spent down a median of just 27.2% over their first 18 years of retirement. About a third of them actually ended up with more money than they started with. It's part of a broader pattern: most retirees die with too much money, not too little.
Now here's the part that got me. When asked why, "afraid of running out" wasn't the top answer. It came in fourth, at 27%. The answer ahead of it, at 31%: "I feel better when my account balances remain high."
They're Managing a Feeling, Not a Portfolio
Read that again. Nearly a third of retirees aren't managing a portfolio. They're managing a feeling.
I'm not going to make fun of that, by the way. I've felt it. There's something deeply reassuring about watching a number go up. But there's a point where that reassurance starts costing you real money, and I want to show you where it is.
Because past a certain balance, the next pre-tax dollar you defer doesn't buy you security. It buys you a tax bill. On a timetable you don't control. At a filing status you might not have. Priced by brackets your surviving spouse is going to face alone.
That threshold has a name among planners: the 401(k) inflection point. I'm going to give you four ways to test whether you've crossed your 401(k) inflection point.
Definition
The 401(k) Inflection Point: The moment your projected Required Minimum Distribution at age 75 exceeds what you'll actually need to spend. Past that point, every additional pre-tax dollar you defer funds a future tax bill, not a future life.
One thing first, and it's important. This is a conditional argument, not a universal one. If you're in the 32% or 35% bracket right now, the deduction usually still wins. Keep deferring. The person I'm writing this for is the 22% or 24% bracket household with $1M or more already sitting in tax-deferred accounts. That's where the math gets thin, and that's where almost nobody notices it flipped on them.
The 4.07% Nobody Shows You
Let's start with the gear that turns everything else.
At age 75, the IRS Uniform Lifetime Table divisor is 24.6. One divided by 24.6 is 4.07%. So your required minimum distribution at 75 is, almost exactly, the famous 4% rule.
The difference is that the 4% rule is a plan and the RMD is a court order.
And the RMD is worse in one specific way. The 4% rule takes 4% of your starting balance and adjusts it for inflation. The RMD takes a percentage of your current balance, and that percentage climbs every single year. At 80 the divisor drops to 20.2, which is 4.95%. By 85, it's 16.0. That's 6.25%.
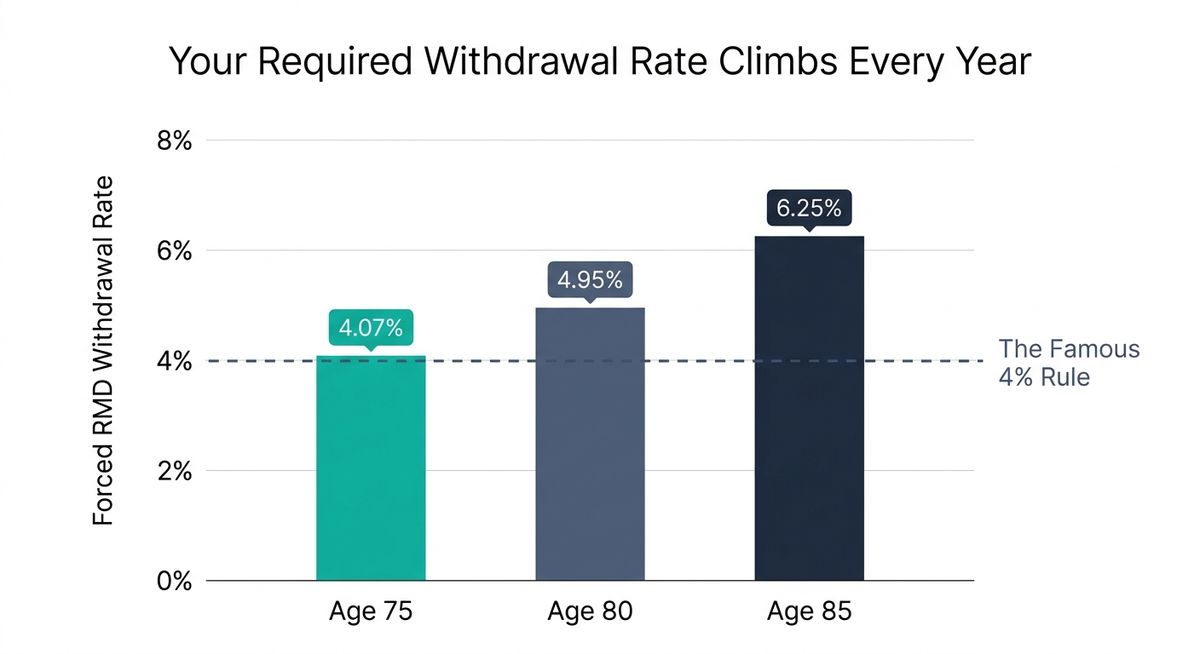
You spend thirty years building a portfolio so you get to choose your withdrawal rate. Then at 73 or 75, depending on your birth year, the government picks it for you.
Let me put real numbers on this. I'm going to follow one household through this whole article so nothing gets muddy. Call them Dave and Marie. Both 55. Combined income of $180,000, roughly $110,000 for him and $70,000 for her. They have $1.2M in pre-tax accounts and they defer $32,500 a year ($24,500 plus the $8,000 catch-up they get for being over 50).
Everything below is in today's dollars at a 4% real return, which is about 6.5% nominal against 2.5% inflation. Brackets held at 2026 levels. That's the only honest way to compare a balance twenty years out against a grocery bill you can actually picture.
| Balance at 75 | RMD at 75 | |
|---|---|---|
| Stops contributing today | $2,629,300 | $106,900 |
| Contributes 10 more years | $3,207,000 | $130,400 |
| Difference | +$577,700 | +$23,500/yr of forced income |
Sit with that bottom right number for a second.
Those extra contributions add up to $325,000. Deducted at 22%, they save Dave and Marie roughly $71,500 in federal tax between now and then. Real money.
In exchange, they create $23,500 a year of income they're legally required to recognize starting at 75. Piled on top of a $106,900 baseline they already couldn't spend.
That's the inflection point right there. It's not a philosophy. It's just arithmetic crossing over.
Editorial Note
The earlier draft ran this projection at 6% nominal and compared the resulting $156,444 RMD against a $95,000 spending need stated in today's dollars. That's a unit mismatch, and a sharp reader would catch it. At 2.5% inflation over 20 years, $156,444 of 2046 money is about $95,400 in 2026 money, which means the draft's dramatic "$61,000 a year they don't want" was almost entirely just inflation. Rerunning in real terms costs us the big scary number but gives us a better one: even if Dave and Marie stop contributing today, the RMD still overshoots what they need. Every table below has been rebuilt on real-dollar figures.
Why the 80% Rule Falls Short
You've heard the rule: replace 80% of your pre-retirement income.
I think that might be the most expensive sentence in personal finance. Because it takes a number driven entirely by your salary and pretends it's a number driven by your life. Those are not the same thing, and they're not even close.
Michael Finke nailed the mechanism. When you retire, you stop putting money into retirement accounts, and you stop paying Social Security and Medicare payroll taxes. Neither of those was ever spending. It was money leaving your paycheck, sure, but it never bought you a single thing you enjoyed.
Laurence Kotlikoff goes further and calls replacement rates basically arbitrary as a planning tool. He's right. Here's what to do instead.
Step 1: The Blueprint. Write out the life. No dollar signs at all. Where do you wake up? How many nights a year are you away from home? Who lives close enough to have dinner with? What does a random Tuesday look like in year one, and what does it look like in year twelve? No spreadsheets yet. This part is supposed to be fun.
Step 2: Real-World Pricing. Now go price it. Not "travel: $10,000." Actual airfare for the actual trip you want to take. Actual property tax and insurance on the actual house. Actual Medicare premiums plus a supplement plan. Real quotes, not category averages. This takes an afternoon and it's the most useful afternoon in the whole process.
Step 3: The Expense Purge. Delete everything that disappears on your last day of work.
| Item | Annual |
|---|---|
| FICA at 7.65% (2026 wage base $184,500) | –$13,770 |
| 401(k) deferral plus catch-up | –$32,500 |
| Commute, parking, work clothes, work lunches | –$7,000 |
| Removed | –$53,270 |
That's 29.6% of gross income that evaporates the day you stop working. Before you give up a single thing you enjoy.
Now let's finish the math, because this is where most versions of this argument get hand-wavy and I don't want to do that to you. Federal tax on $180,000, minus the $32,500 deferral and the $32,200 joint standard deduction, leaves $115,300 of taxable income and a federal bill around $14,790. Add roughly $5,800 of state tax in a middle-of-the-road state.
What's actually left over to live on is about $106,000. That's the ceiling. That's the number to beat. Not $144,000.
And when Dave and Marie sat down and priced their blueprint line by line, they came in at $95,000.
Now watch what happens to the targets. The 80% rule says $144,000 a year times 25, so $3,600,000. Reverse mapping says $95,000, and Social Security covers most of that:
| Social Security | Portfolio gap | At 4.0% | At 4.7% |
|---|---|---|---|
| $70,000 | $25,000 | $625,000 | $532,000 |
| $67,200 | $27,800 | $695,000 | $591,000 |
| $60,000 | $35,000 | $875,000 | $745,000 |
Even if you use the full $106,000 ceiling with $67,200 of Social Security, the gap is $38,800, which is $970,000 at 4%. Gross it up for taxes on the withdrawals, call it $1.1M.
So the rule of thumb overshoots by four to six times. And that overshoot isn't measured in dollars. It's measured in years of your life.
Two research points make this sharper. Bill Bengen, the guy who invented the 4% rule, revised it upward to 4.7% in his 2025 book — a shift we break down in why the 4% rule is officially dead in 2026. And he's explicit that 4.7% is the worst case, the rate that survived the October 1968 cohort. The average across all 349 cohorts he studied was about 7.1%.
Separately, David Blanchett published a paper in Financial Planning Review this past June finding that while the average retiree's spending traces that famous U-shaped "smile," the median retiree follows what he calls a "smirk." Spending drops early and just keeps drifting down. No late-life rebound at all. Michael Stein's go-go, slow-go, no-go years are showing up right there in the data.
So stack a worst-case withdrawal rate on top of an inflated spending assumption and you've layered conservatism on conservatism until your target is several times bigger than your actual life.
Editorial Note
The draft cited Blanchett's "$100,000 goal troughs at $74,146, a 26% drop." I couldn't independently confirm that figure in any secondary coverage, and the paper distinguishes median from average results. I swapped in the smile/smirk finding, which is confirmed and makes the same point.
The Accumulation Mindset vs. The Distribution Reality
| Accumulation Mindset | Distribution Reality | |
|---|---|---|
| Goal | Get the balance as big as possible | Get the most after-tax, after-IRMAA money you can actually spend |
| Tax view | A deduction today is a win | Your rate today vs. the rate on your last forced dollar at 75 |
| Who controls timing | You do | The IRS does. 4.07% of the balance at 75, no discussion |
| Filing status | Married filing jointly, forever | Single, for the survivor's final decade or more |
| Healthcare | A future line item | A cliff at $109k single / $218k joint. One dollar over costs $1,148 to $7,933 a year |
| Scarce asset | Money | Healthy years. Roughly 13 or 14 of them after 65 |
| Success metric | Portfolio size | Does the plan fund the life, with the fewest years traded to get there |
The 4 Signals You've Already Crossed the Line
You can run every one of these this weekend. None of them requires an advisor.
Signal 1: Your projected RMD at 75 is bigger than what you actually need to spend
Take your current pre-tax balance. Grow it at 4% real to age 75. Divide by 24.6. This is exactly the calculation most people never run — see 84% of retirees make this RMD mistake for how often it gets skipped entirely.
If that number is bigger than the annual spending your blueprint produced, every extra pre-tax dollar you put in is funding a tax bill, not a life.
Dave and Marie clear this signal without contributing another dollar. A $106,900 RMD against a $95,000 need means they're already on the hook to recognize about $12,000 a year they didn't ask for. Ten more years of maxing out turns that $12,000 surplus into $35,400.
So the question was never "have we saved enough." The question is what the next $325,000 is actually for.
Signal 2: Guaranteed income already covers your baseline
Add up Social Security (the 2026 max at full retirement age is $4,152 a month, or $5,181 if you wait until 70) plus any pension. If that covers housing, food, insurance, and healthcare, your portfolio just changed jobs.
It's not survival money anymore. It's lifestyle money. And lifestyle money should be optimized for flexibility and tax control, not for maximum size.
Two things worth knowing here. First, that guaranteed income is quietly getting eaten. Medicare Part B jumped 9.7% to $202.90 a month in 2026, first time it's ever cracked $200. That single increase ate more than a quarter of the entire 2.8% Social Security COLA. Budget the premium, not the raise.
Second, and this one's fascinating: EBRI found that retirees with pensions drew down only 4% of their median non-housing assets over 18 years. Non-pensioners drew down 34%. So guaranteed income doesn't make people spend more freely. It makes them hold on tighter. I don't fully understand why, but the data is the data.
Signal 3: Your current effective rate is below your future forced rate
This is the Bogleheads heuristic and it's the cleanest way I've seen it put: go Roth if you can get dollars out at a rate less than or equal to the rate they would have gone in at.
Compare your effective rate today to your projected rate at 75. And include the surcharges, because the surcharges are where the real damage hides.
Here's the thing about IRMAA that catches people. It's a cliff, not a ramp. One dollar over $218,000 of joint MAGI in 2026 triggers the full surcharge, for both spouses, for a full year. Not a partial phase-in. The whole thing.
And there's a two-year lookback, which means your income at 63 determines your Medicare premium at 65. Almost nobody in the 48-to-64 crowd knows this, and it's something you can act on right now, today.
Worth noting what a six-figure RMD does to the Social Security tax torpedo, too. Inside the provisional-income phase-in range, one extra dollar of income can make $1.85 of your Social Security taxable, which produces effective marginal rates north of 40% for somebody who's nominally in the 22% bracket. Brutal.
Dave and Marie never see it, though. At $130,000 of RMD they're already pinned at the 85% maximum. The torpedo isn't a threat to them. It already went off, years ago, and there's no dial left to turn.
Signal 4: Survivor bracket compression
This is the one everybody skips, and it's the most expensive one on the list.
Same household at 75, with $67,200 of combined Social Security and that $130,400 RMD:
Couple (MFJ)
- Social Security $67,200
- RMD $130,400
- MAGI $187,520
- Federal income tax ~$22,870
- Marginal bracket 22%
- IRMAA tier None
- Total federal cost $22,870
Survivor (Single)
- Social Security $40,800
- RMD $130,400
- MAGI $165,080
- Federal income tax ~$27,860
- Marginal bracket 24%
- IRMAA tier $137k–$171k ($2,885)
- Total federal cost $30,745
Household income dropped by $26,400. Total federal cost went up by $7,875.
Nothing changed except a death certificate.
The mechanism is one sentence: every IRMAA single-filer threshold is exactly half the joint threshold, and the RMD doesn't shrink when the household does. As a couple, that MAGI sat $30,480 under the first IRMAA cliff. As a survivor, the exact same money sits $56,080 over it. And the next tier up is only $5,900 away.
Two practical refinements the draft left out, both of which matter. IRMAA runs on a two-year lookback against the return actually filed, so a new widow or widower is still measured against joint thresholds for roughly two years before the compression really bites. And "death of spouse" is one of the eight qualifying life-changing events on Form SSA-44, which forces Social Security to re-determine the premium against current income. Adjustments are often retroactive.
Almost nobody files it. Please file it. (Our widow's financial survival guide walks through the rest of what changes when a spouse dies.)
The Strategic Redirect
Stopping pre-tax contributions and stopping work are two completely different decisions. You can absolutely do the first without the second, and I'd guess most people reading this should.
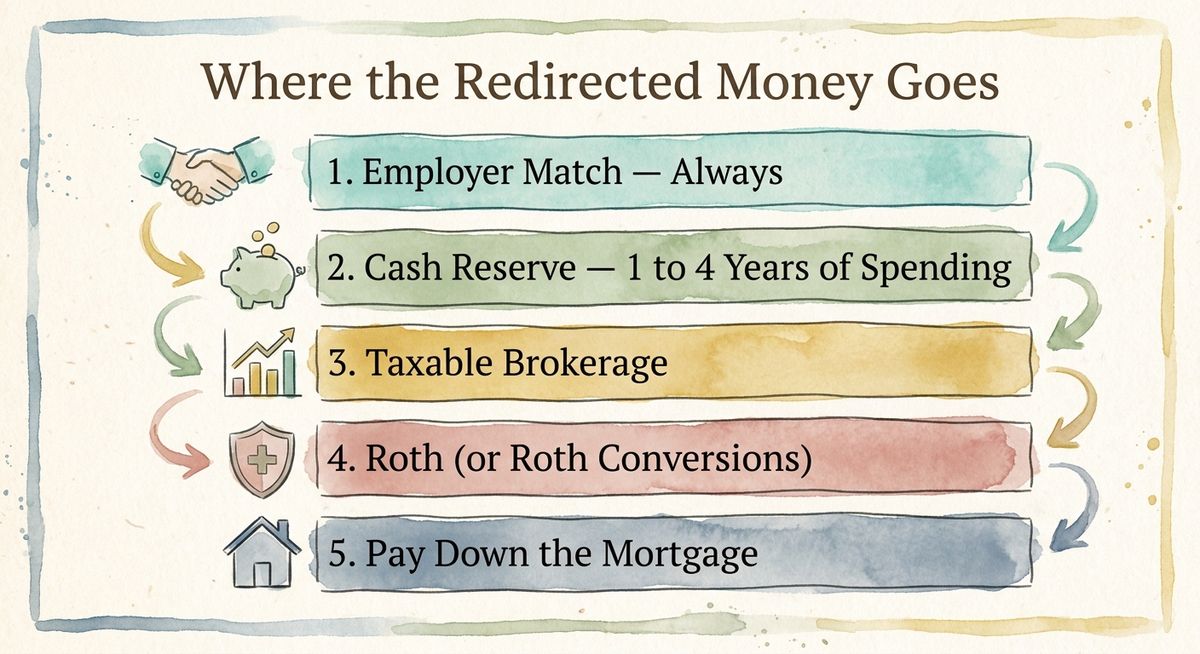
Take the full employer match. Always. It's an instant return that no tax strategy on earth beats. And under SECURE 2.0, the match itself can be Roth if your plan allows it. Then stop, and redirect what's left.
Liquid cash reserve. Wade Pfau's research suggests roughly 77% of a retirement outcome comes down to returns in the first ten years. Sequence risk is real. One year of spending in cash plus two to four years in short-term bonds keeps you from selling into a downturn.
Honest caveat, because I don't want to oversell this: Kitces's research shows bucket strategies produce basically identical mathematical outcomes to just rebalancing a total-return portfolio. The value of the cash reserve is behavioral, not mathematical. It keeps you from panic selling, which is worth a lot. But don't let anyone sell it to you as some kind of edge. It isn't.
Taxable brokerage. Everybody talks about the capital gains rate, and 0% up to $98,900 of taxable income for joint filers is genuinely great. But that's not the underrated part.
The underrated part is that only the gain counts toward MAGI, not the whole withdrawal. That one property is what gives you surgical control over IRMAA cliffs and Social Security provisional income. Then add step-up in basis for your heirs, tax-loss harvesting, no RMDs, and no early withdrawal penalty. It's a genuinely underappreciated account.
Roth. Tax-free growth, no RMDs since 2024, and zero impact on your survivor's brackets. Congress has already made part of this call for some of you: as of January 1, 2026, if you're 50 or older and earned over $150,000 in Social Security wages from that employer in 2025, your catch-up contributions must be Roth. So on $8,000 of it, the government picked your inflection point for you. The other $24,500 is still your call.
But the highest-leverage move here isn't a contribution at all. It's filling up the 12% and 22% brackets with Roth conversions during the gap years, that stretch between your last paycheck and your first RMD. That window is the lowest-tax period of most people's entire lives, and here's the kicker: it shrinks by one year for every extra year you work.
Two sequencing notes so you don't get surprised. A conversion in 2026 hits your IRMAA in 2028. And a QCD (age 70½, $111,000 limit in 2026) reduces your AGI but does not offset conversion income. Different line items entirely. Mixing those up is an expensive mistake.
Kill the fixed debt. A $1,500 monthly mortgage is $18,000 a year. At a 4% safe withdrawal rate, funding that payment requires $450,000 of portfolio.
Let that land. Paying off the house does the work of nearly half a million dollars. Guaranteed return, zero sequence risk, and you sleep better. I've never met anyone who regretted it.
About Michael Kitces
The strongest pushback on everything I've written comes from Michael Kitces, who argues that maxing pre-tax during your peak earning years and then converting aggressively in the gap years is the optimal sequence.
He's not wrong. And I'm not arguing with him.
His own framing of the problem is that an account "allowed to compound long enough will eventually be so large that the retiree is driven into even higher tax brackets just trying to tap the account." His stated optimum: defer enough to avoid high rates now, not so much that you cause much higher rates later.
That's an equilibrium. The only disagreement is about where your 401(k) inflection point sits.
What the worked examples above show is that once you actually price in IRMAA cliffs and the survivor's single brackets, that equilibrium lands considerably lower than most 22% and 24% bracket households assume. The task isn't to stop saving. It's to find your equilibrium and quit pretending it doesn't exist.
Two other objections deserve straight answers.
"What if tax rates go up?" This was the single best argument for deferring, for about eight years running. And then it expired. OBBBA made the TCJA rate schedule permanent in July 2025. The 2026 sunset that everybody built their planning around is gone. Rates can still change, sure, but now you're betting on future legislation instead of pointing at something already on the calendar. Big difference.
"What about healthcare?" Fidelity's 2026 estimate of $185,500 per 65-year-old is the number people throw at this argument most often. So let's look at what's inside it.
It's a lifetime figure spread across twenty-plus years. That's roughly $8,000 to $9,000 a year per person. About 45% of it is Part B and Part D premiums, which your blueprint already priced in Step 2. Another 48% is Medicare cost-sharing, which is real and absolutely belongs in your plan. And it excludes long-term care entirely, which you need to underwrite separately.
It's a legitimate number. It's not a reason to work five more years.
The Number That Should Actually Drive This
Here's the figure I think should really be making this decision, and it isn't a portfolio balance.
A typical 65-year-old in the United States has 18 to 21 years of remaining life expectancy, but only 13 or 14 healthy years (what researchers call health-adjusted life expectancy). Women at 65 average 20.5 total years, men 18.1. So roughly a third of the time you have left after 65 will be lived with some meaningful health limitation.
There's agency in that number, by the way. It's not pure fate. People with no behavioral risk factors can expect up to 11 more disability-free years than people with two or more. That's an enormous return on going for a walk.
But the math of working three extra years at 62 is unforgiving. You're trading three go-go years, out of a stock of maybe thirteen, to grow a balance the IRS is going to force you to withdraw at 4.07% and tax at your survivor's single-filer rate.
Money compounds. Healthy years don't.
Your Weekend Audit
Four steps. A spreadsheet and about two hours.
🎯 The Weekend Audit
- Run the RMD: Current pre-tax balance, grown at 4% real to age 75, divided by 24.6. Write the annual number down. Use a real return, not a nominal one, or you'll fool yourself by exactly the rate of inflation.
- Reverse map the spending: Blueprint it, price it, then subtract FICA, contributions, work costs, and the taxes you stop paying. Compare that to step 1. If step 1 is bigger, you've already crossed the line.
- Model the survivor: Rerun your projected retirement income as a single filer, one Social Security benefit gone, RMD unchanged. Note the bracket and the IRMAA tier. This is the most neglected calculation in all of retirement planning and it takes fifteen minutes.
- Redirect one contribution: Keep the match, move the rest to Roth or taxable, and map out your gap-year conversion window now while it's still wide. Stick Form SSA-44 in the same folder while you're at it.
And look, if the audit tells you that you're done, the hard part isn't the math. The hard part is accepting a finish line that nobody in your entire financial ecosystem has any reason to point out to you.
That's on you to see. Which is why I wrote this.
Thanks for reading if you made it this far. Go price your blueprint.
Peace!
All figures are 2026 tax year, in today's dollars, with 2026 brackets held constant for illustration. Brackets index every year; the ratios are the point, not the exact dollars. The senior bonus deduction is deliberately left out of the age-75 projections because it sunsets after 2028. This is analysis, not personalized advice.